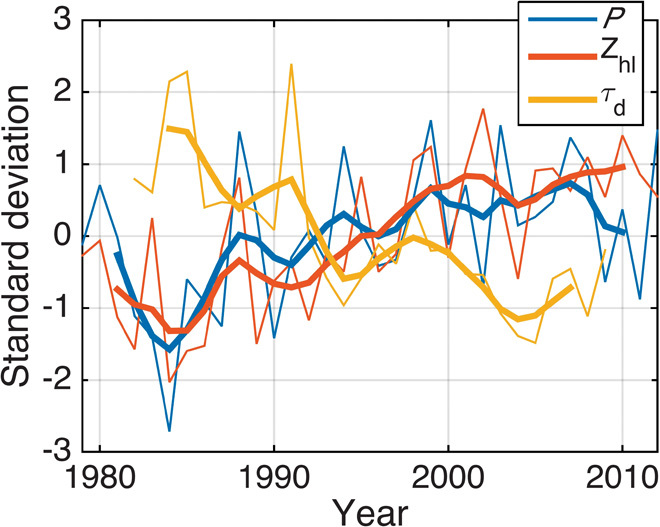
Fig. 1. Seasonal (June to August) time series of Zhl (blue), precipitation (P, green), and τd (red).

The monthly mean precipitation series is averaged over 5°W to 20°E, 10° to 20°N, and τd is averaged over 10° to 65° W and 0° to 30°N. The thin lines are the seasonal means, and the thick lines are the five-season smoothed time series (via a 1-4-7-4-1 filter).
