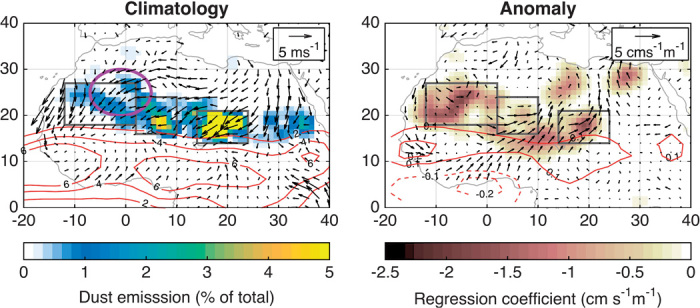
Fig. 2. Climatology and regressed precipitation and winds.

(A) Shown is a map of long-term mean dust emission (shading), seasonal mean precipitation (magenta contour lines, mm day−1), and seasonal mean 925-hPa climatological wind vectors (June to August). Dust emission rates are in nondimensional units of % of total annual mean of North Africa dust emission rates. The red circle indicates the location of the mean seasonal (June to August) position of the SHL. The brown boxes are the major dust hotspots of the Bodélé depression (14° to 24°E, 14° to 21°N), the depression in the lee of the Aïr and Adrar Mountains (2° to 10°E, 16° to 24°N), and the Mauritania and Western Sahara source region (12° to 2°W, 18° to 27°N, dashed lines). (B) Map of the coefficients of the regression of 925-hPa meridional and zonal winds (vectors and shading) and precipitation onto Zhl, for June to August and 1979 through 2012. Vectors are all unit length to indicate anomalous wind direction, and the shaded regions are the wind speed coefficients, where only coefficients statistically significant at the 90% level are shown.
