
Fig. 1. Global frequency and abundance of HgcA based on the metagenomic projects evaluated.
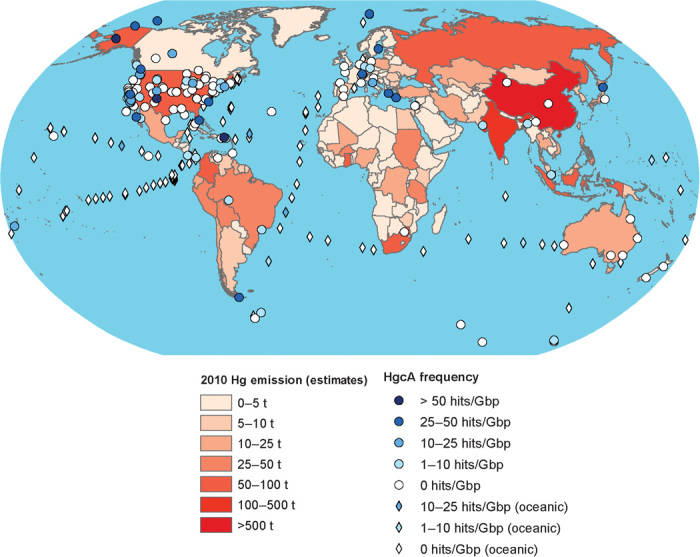
Overlay is the estimated continental emission of Hg (in tons) based on “UNEP Global Mercury Assessment 2013: Sources, Emissions, Releases and Environmental Transport” (2). Diamonds represent pelagic ocean water samples, whereas circles represent all other samples. The abundance of Hg emissions and hgcA is colored according to the accompanying legend.