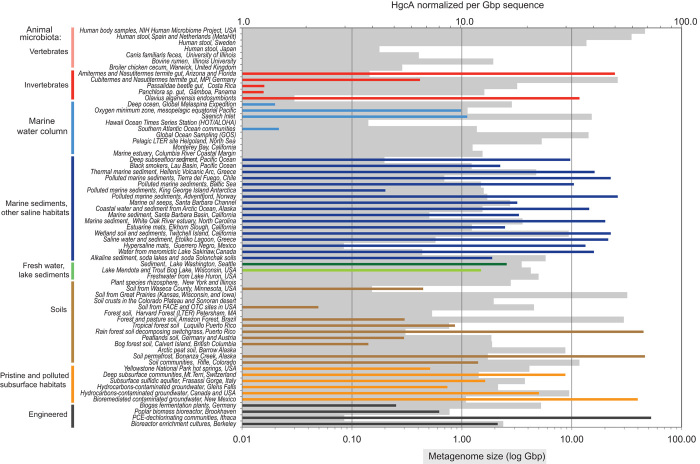
Fig. 2. Distribution and relative abundance of HgcA in metagenomic projects, by environment type.
Each metagenomic project includes a wide-ranging number of metagenome sequencing data sets. Each bar represents a metagenome project. Gray bars indicate metagenome size. Colored bars represent HgcA abundance normalized to 1 Gb of metagenomic sequence. Overall, about two-thirds of 3500 metagenomes and 140 of 203 metagenome projects did not reveal any hgcA. PCE, polychloroethylene.

