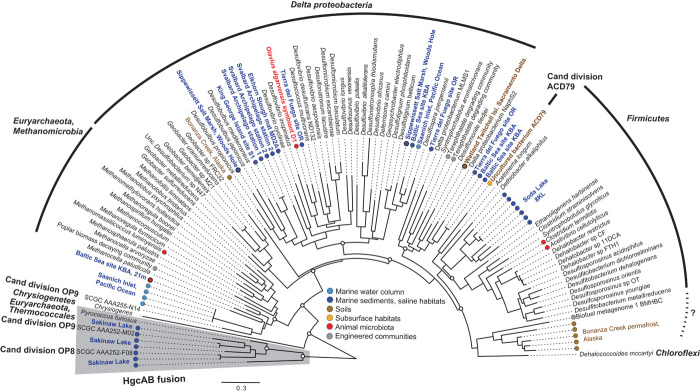
Fig. 3. Maximum likelihood phylogeny of HgcA proteins in complete genomic and metagenomic sequences.
Open circles at major nodes denote bootstrap support values >50. Gray-shaded clades represent the fused HgcAB sequences. Sequences with colored circles and color naming indicate full-length HgcA from metagenomes, with the color corresponding to the metagenome classification in Fig. 2.

