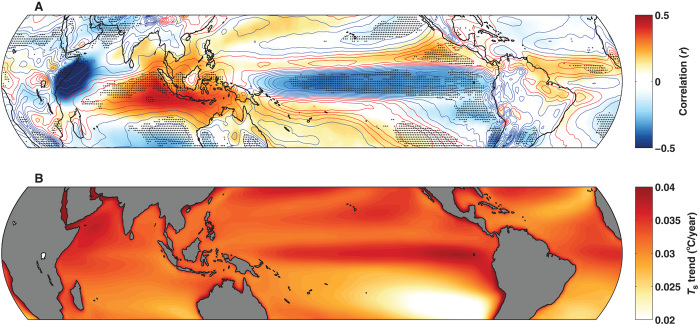
Fig. 4. Simulated 21st century changes (from the RCP 8.5 scenario) in mean annual 700 mbar vertical velocity and skin temperature in the tropics and their relation to Horn of Africa rainfall.
(A) Multimodel mean of the correlation between eastern Horn of Africa rainfall (average across 0–12°N and 40–55°E) and 700 mbar vertical velocity (colors) and the trend in 700 mbar vertical velocity (contours). Red contours indicate a positive trend; blue contours, a negative trend. Stippling indicates areas where 90% of the models agree on the sign of the trend. (B) Multimodel mean of the trend in skin temperature (Ts, effectively SST) over the tropical oceans.

