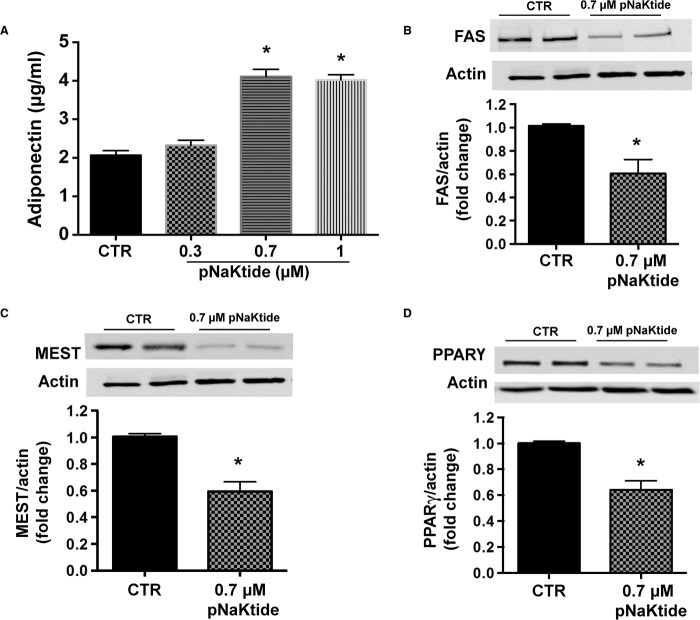
Fig. 2. pNaKtide increased adiponectin levels and decreased adipogenic markers in 3T3L1 adipocytes.
(A) Adiponectin levels were determined in conditioned media obtained from 3T3L1 cells after treatment with pNaKtide for 7 days. Cells were treated with varying concentrations of pNaKtide, and 0.7 μM pNaKtide was determined to be the optimal concentration for increasing adiponectin levels. Results are means ± SE, n = 4; *P < 0.05 versus control (CTR). (B to D) Expression of (B) FAS, (C) MEST, and (D) PPARγ was determined by Western blot analysis in 3T3L1 cells after treatment with pNaKtide (0.7 μM) for 7 days. Quantitative densitometric evaluation of protein ratios was done. Data are expressed as means ± SE, n = 6; *P < 0.05 versus control.

