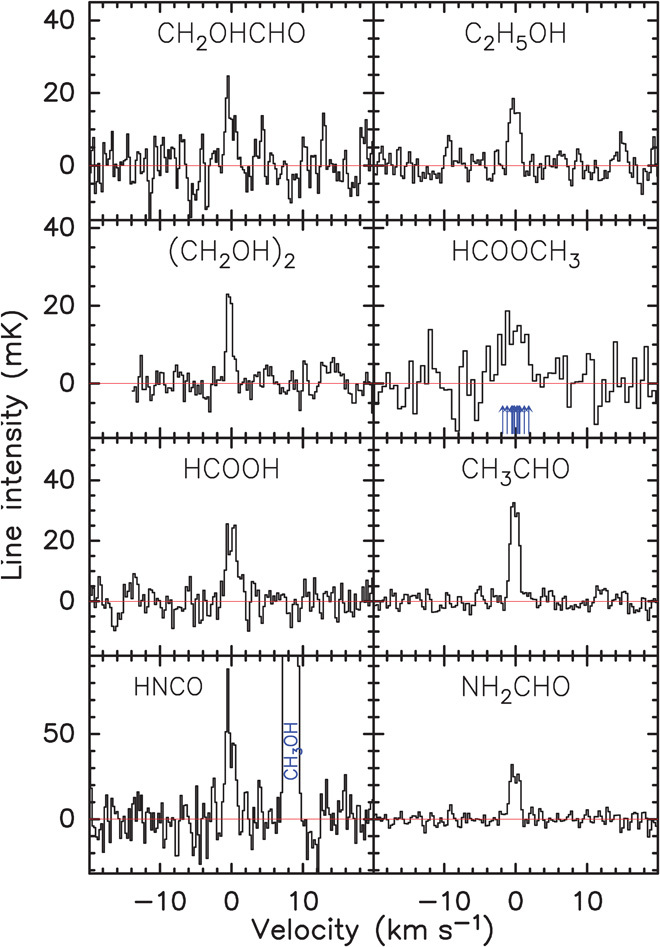
Fig. 1. Spectra of organics in comet C/2014 Q2 (Lovejoy).

The observations were obtained with the IRAM 30m radio telescope in the 211–272 GHz band between 13 and 25 January 2015. The velocity scale is in the nucleus rest frame. Intensity is given in the main beam temperature scale. Spectra, from top left, are glycolaldehyde (CH2OHCHO, average of two lines), ethyl alcohol (ethanol, C2H5OH, average of 13 lines), aGg′ ethylene glycol [(CH2OH)2, average of 14 lines], methyl formate (HCOOCH3, average of two groups of blends of several lines, whose positions are marked by blue arrows), formic acid (HCOOH, average of six lines), acetaldehyde (CH3CHO, average of 40 lines), isocyanic acid [HNCO(110,11–100,10) line at 241.774 GHz], and formamide (NH2CHO, average of 10 lines). The signal-to-noise ratio is 6 for glycolaldehyde, 10 for ethanol, and higher than 7 for the other molecules.
