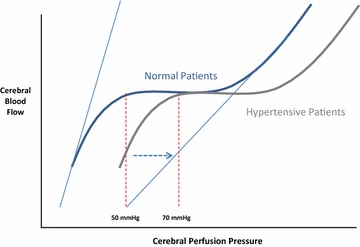
Fig. 3.

Theoretical relationship between cerebral perfusion pressure (CPP) and cerebral blood flow using the same construct as in Fig. 1. Here, the autoregulatory range for subjects without hypertension (normal patients) is in blue and that for patients with hypertension (hypertensive patients) is shown in gray. Note that the minimal CPP within the autoregulatory zone for normal is about 50 mmHg whereas for those with hypertension it is shifted rightward with CPP on the x-axis to 70 mmHg. Again the maximal vasoconstriction and vasodilation instantaneous CCP-cerebral blood flow relations for normal patients are shown as the light blue lines
