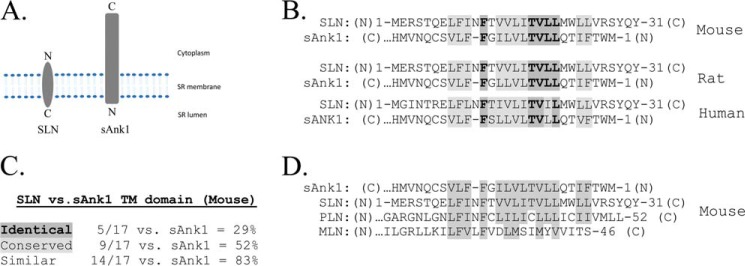
FIGURE 1.
Sequence comparison in transmembrane regions of sAnk1 and SLN. A, relative orientation of sAnk1 and SLN within the SR membrane. B, residues that are identical or conserved in sAnk1 and SLN are highlighted in dark and light gray, respectively. C, percent similarity between sAnk1 and SLN. D, mouse amino acid sequence comparison of the transmembrane regions of sAnk1, SLN, PLN, and MLN. Similar residues are highlighted in gray.

