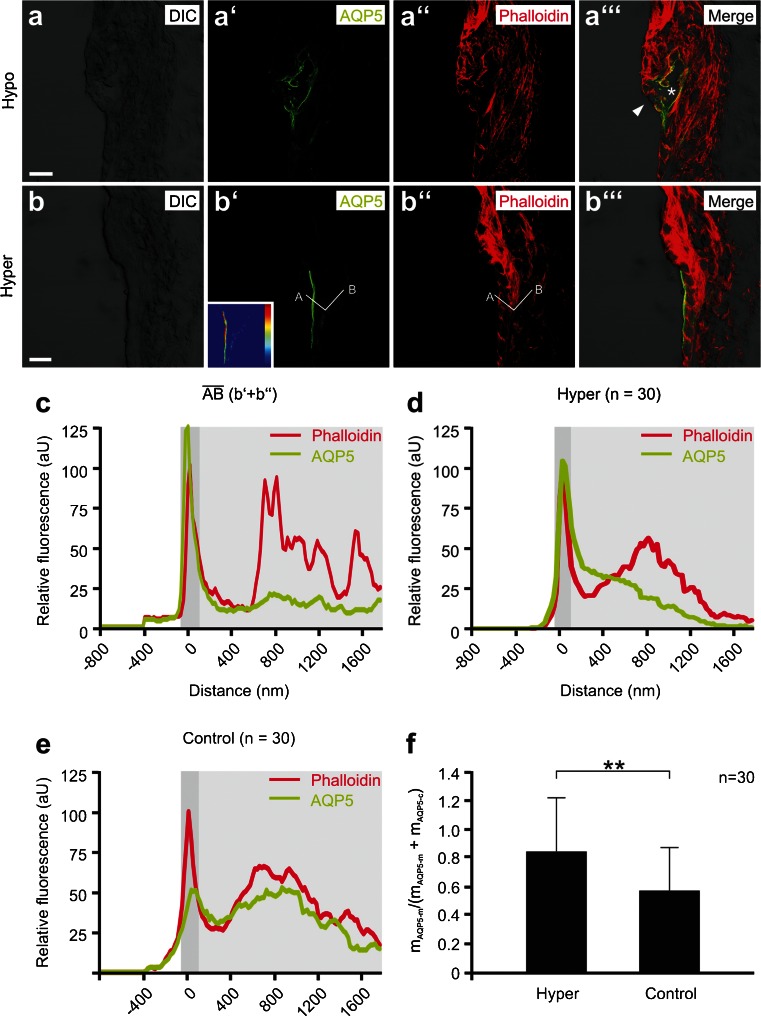
Fig. 2.
Membrane translocation of AQP5 in outer sulcus cells (OSCs) induced by perilymphatic hyperosmolarity in vitro. a–a”’ Representative confocal images of AQP5 and phalloidin fluorescence in the spiral ligament from a cochlea that was perilymphatically perfused and incubated with a solution that was hypoosmolar (200 mOsm/L) compared with the endolymph. The overall morphology of the cochlear duct epithelium appeared normal (Supplementary Figure 2); only OSCs in the apical turn showed signs of cellular damage, i.e., disruption of their cytoplasm (asterisk, c”’) and apical membranes, as indicated by the discontinuity of the phalloidin and AQP5 signals at their luminal cell borders (white arrowhead, c”’). b, c Representative confocal images of AQP5 and phalloidin fluorescence in the spiral ligament from a cochlea that was perilymphatically perfused and incubated with a hyperosmolar solution (400 mOsm/L). The inlay in (b’) shows the color-coded AQP5 fluorescence intensity (dark blue, low intensity; dark red, high intensity) in the OSCs from (b’). Along the white line (b’ and b”) that crosses the apical membrane and the cytoplasm of a single OSC, histograms of phalloidin and AQP5 fluorescence intensities (c) were generated. The dark gray-shaded area in the diagram indicates the apical cell membrane, which was defined by the first peak of phalloidin fluorescence; the light gray-shaded area indicates the cytoplasm. d Average curves of AQP5 and phalloidin fluorescence intensities derived from 30 measurements from the experimental group “hyperosmolarity” (n = 30). e Average curves of AQP5 and phalloidin fluorescence intensities derived from 30 measurements from the “isoosmolarity” experimental group (n = 30). f Quantitative comparison of the mAQP5m/(mAQP5m + mAQP5c) ratios for the “hyperosmolarity” and “isoosmolarity” experimental groups. Error bars indicate the SD one-way ANOVA followed by Tukey’s post hoc test: **p ≤ 0.01; scale bars: 10 μm

