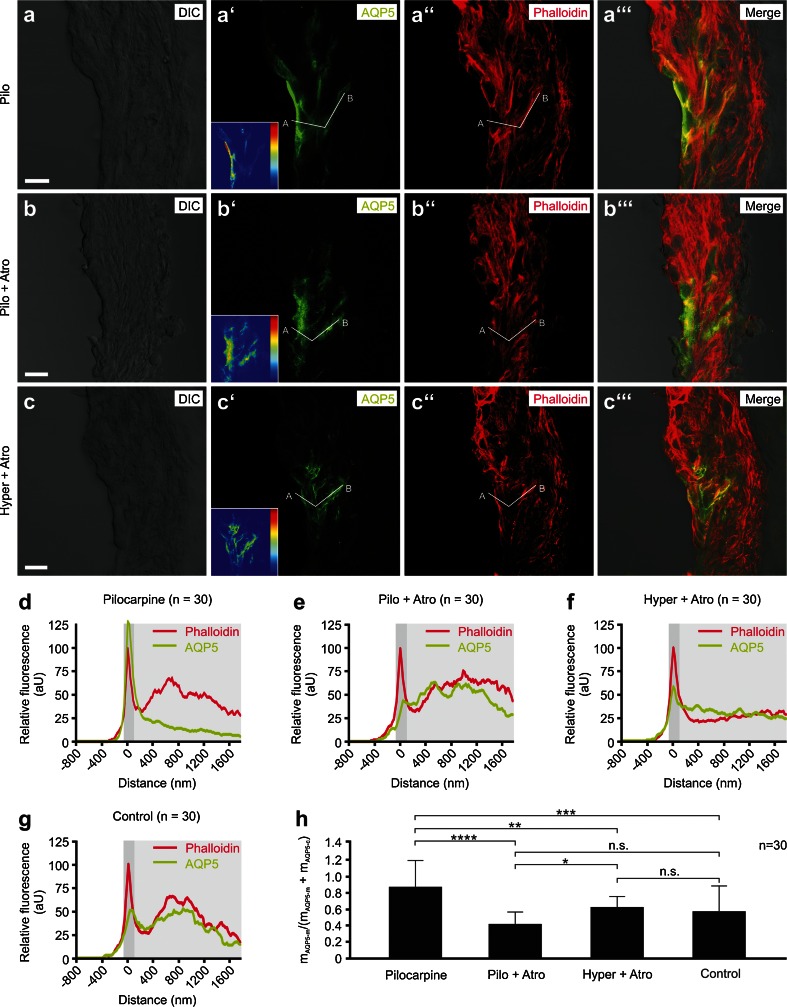
Fig. 4.
Membrane translocation of AQP5 in outer sulcus cells (OSCs) in vitro is controlled by muscarinic (M3) acetylcholine receptors. a–c”’ Representative confocal images of AQP5 and phalloidin fluorescence in the spiral ligament of the apical turn of cochlear specimens from the “pilocarpine” (a–a”’), “pilocarpine + atropine” (b–b”’), and “hyperosmolarity + atropine” (c–c”’) experimental groups. Inlays in (a’), (b’), and (c’) show the color-coded AQP5 fluorescence intensity (dark blue low intensity; dark red high intensity) in OSCs. White lines in (a’), (a”), (b’), (b”), (c’), and (c”) were used to generate histograms of phalloidin and AQP5 fluorescence intensities for single OSCs. d–g Average curves of AQP5 and phalloidin fluorescence intensities derived from 30 measurements (n = 30) from the pilocarpine, pilocarpine + atropine, hyperosmolarity + atropine, and isoosmolarity experimental groups. The dark gray-shaded area in the diagrams indicates the apical cell membrane, which was defined using the first peak of phalloidin fluorescence; the light gray-shaded area indicates the cytoplasm. h Quantitative comparison of the mAQP5m/(mAQP5m + mAQP5c) ratios that were calculated based on the data shown in d–g. Relative fluorescence intensity (rel. FI) in d–g is shown in arbitrary units (aU). Error bars indicate the SD, one-way ANOVA followed by Tukey’s post hoc test: n.s. no statistical significance; *p ≤ 0.05; **p ≤ 0.01; ***p ≤ 0.001; ****p ≤ 0.0001. Scale bars: 10 μm

