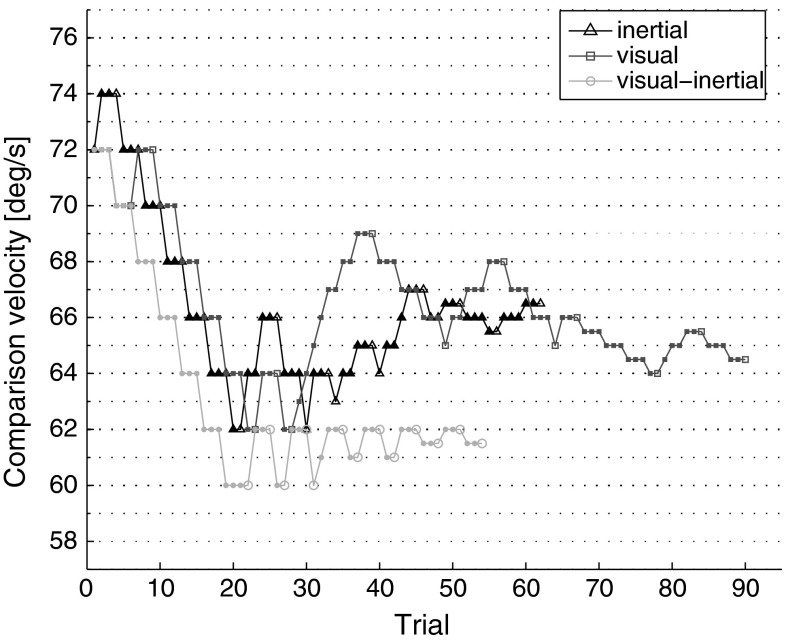
Fig. 3.
Evolution of the adaptive algorithms for one participant in the inertial (black line), and visual–inertial (red line) conditions. Blue line represents data re-plotted from Nesti et al. (2015), where DTs for visual-only motion cues were measured using an identical adaptive procedure. Reference velocity was 60 °/s. Empty markers indicate reversals (color figure online)

