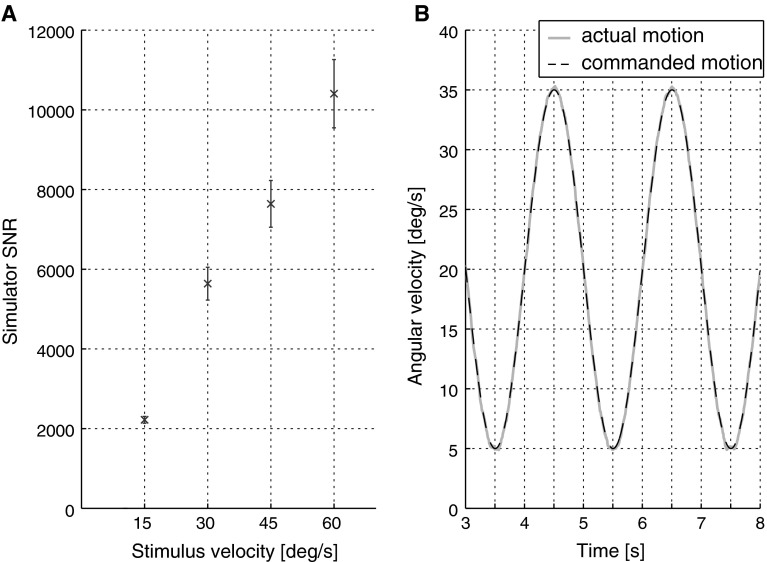
Fig. 4.
SNR analysis of the motion stimuli employed in this study. a SNRs increase for increasing rotational intensities, resulting in the highest comparison stimulus (peak amplitude of 60 °/s) having an SNR approximately five times higher than the lowest comparison stimulus (peak amplitude of 15 °/s). Error bars represent ±1 SEM. b Comparison of the commanded and recorded motion profile for one stimulus with 15 °/s amplitude

