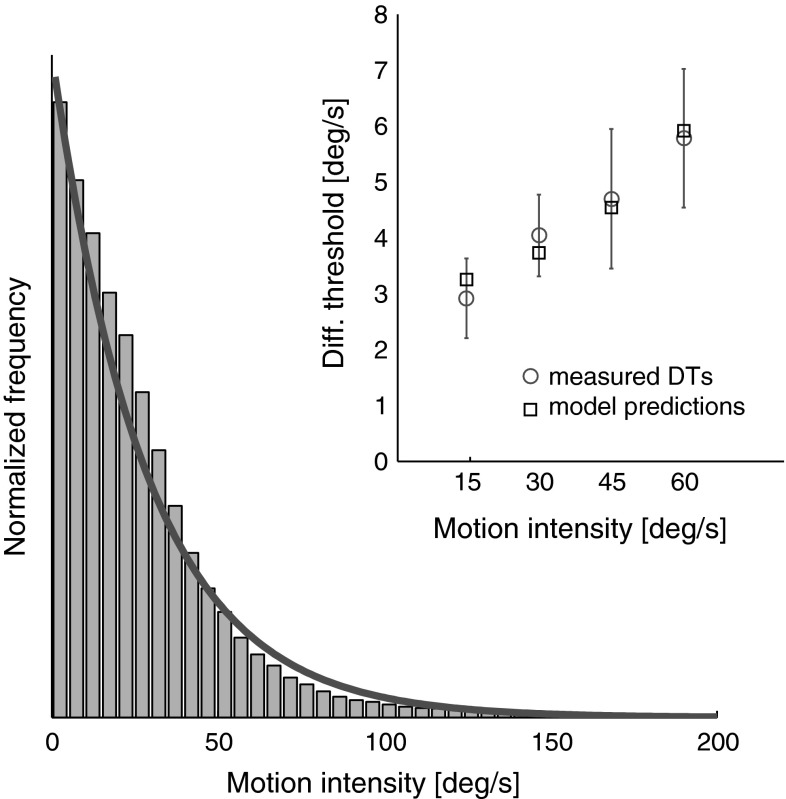
Fig. 7.
Physical stimulus statistics obtained using an IMU are presented in a histogram where bars represent the normalized occurrence frequency of yaw rotational velocities during a 40 min running session. Normalized frequencies are obtained by dividing the histogram of yaw data samples by its area. Fitting data with an exponential distribution [red line, y(S) = 28.5 * exp(−28.5 * S), where S is the stimulus intensity and y(S) is the exponential distribution] allows development of a simple model [ΔS = a + b * 1/y(S)] that relates DTs to motion intensity by accounting for how frequently a particular intensity occurs. Error bars represent ±1 SEM (color figure online)

