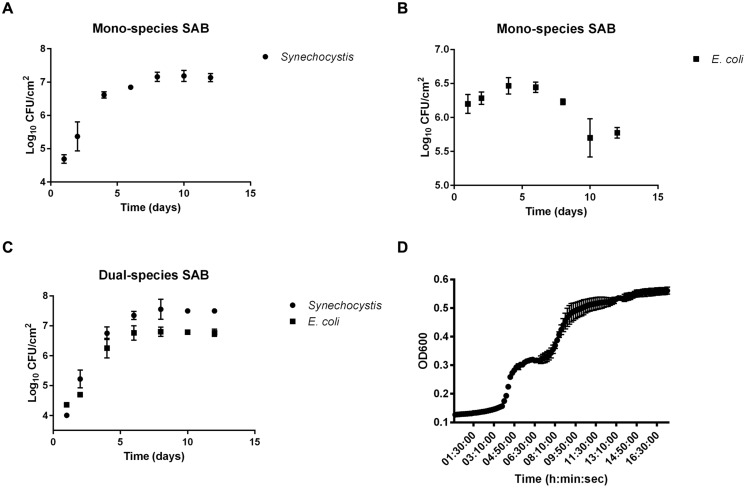
FIGURE 1.
Biofilm growth curves. Biofilm growth of Synechocystis and Escherichia coli in mono (A,B, respectively) and co-culture (C). Data points are average of triplicate experiments. Error bars represent standard deviation of experiments. Panel (D) shows the growth of E. coli on cyanobacterial EPS. Data points are average of triplicate experiments. Error bars represent standard deviation of experiments.

