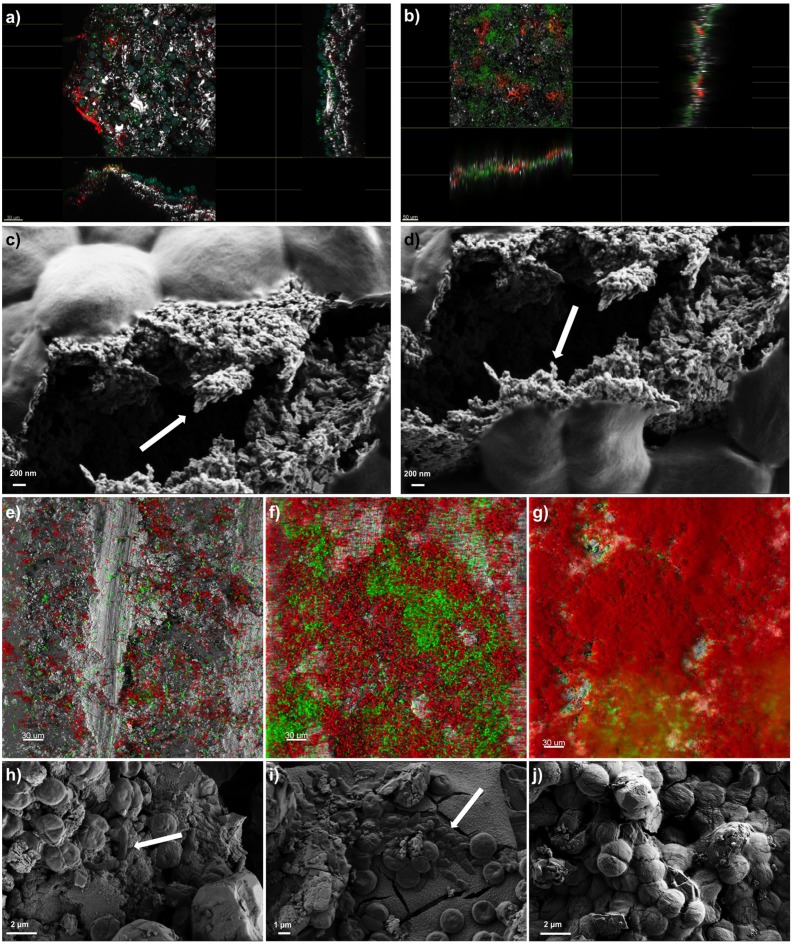
FIGURE 2.
Biofilm imaging by Confocal Laser Scanning Microscopy (CLSM) and Field Emission Scanning Electron Microscopy (FE-SEM). Panel (a) shows the extended view (z-y and z-x planes) of a SAB colonizing the marble surface of the Lincoln Memorial (Washington, DC, USA). Scale bars represent 30 μm. Color key: heterotrophs, green; Phototrophs, blue; EPS-labeled ConA, red; reflection from inorganic materials, gray. Panel (b) represents the extended view (z-y and z-x planes) of a mature dual-species SAB. Scale bars represent 50 μm. Color key: Synechoscystis cells, green; EPS-labeled ConA, red; reflection from inorganic materials, gray. Panels (c,d) show the EPS of a mature dual-species SAB. Arrows indicate the fibriform extracellular matrix-like structures. Panels (e–g) display the development of a dual-species SAB over time monitored by CLSM. Scale bars represent 30 μm. Color key: E. coli cells, green; Synechocystis cells, red; reflection from inorganic materials, gray. Panels (h–j) show the FE-SEM micrographs of cells arrangement during the development of the dual-species SAB over time. Arrows indicate the rod-shaped E. coli cells. The images reported are representative of different images taken from independent experiments.

