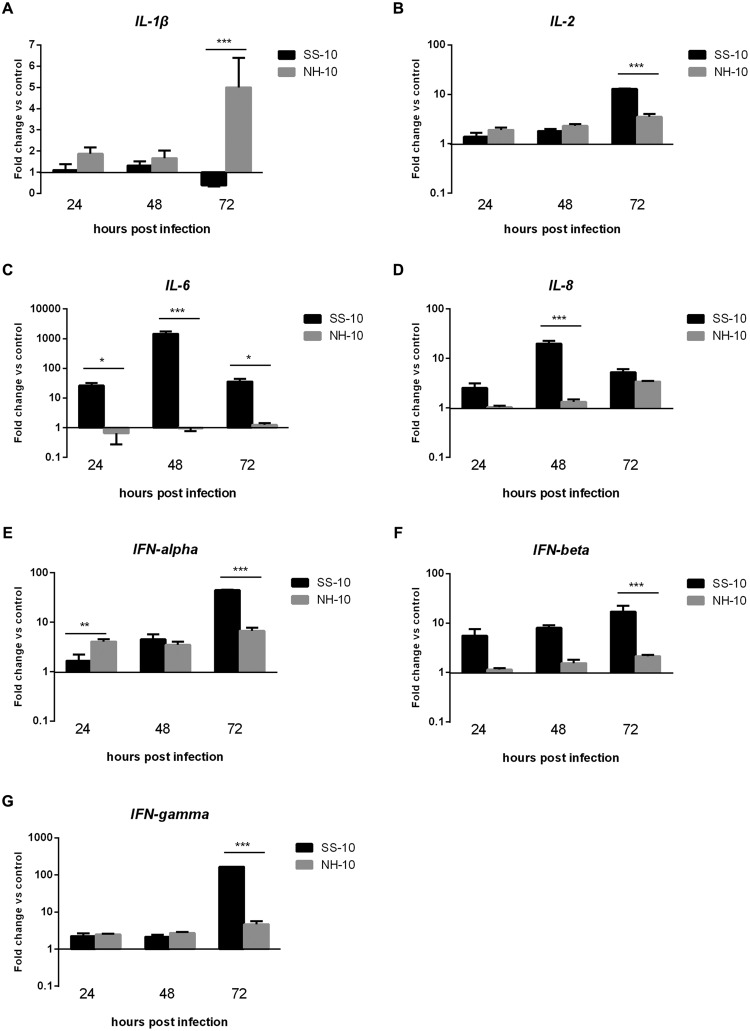
FIGURE 5.
Fold change expression of cytokines in the thymuses of infected ducks in response to SS-10 and NH-10. (A) IL-1β, (B) IL-2, (C) IL-6, (D) IL-8, (E) IFN-alpha, (F) IFN-beta, (G) IFN-gamma. The Y-axis represents the fold change in target gene expression in the experimental group relative to those in the control group and presented as the mean values ± standard deviation (n = 3). Significance is analyzed with two-way ANOVAs between SS-10 group and NH-10 group at the same time points (∗p < 0.05, ∗∗p < 0.01, ∗∗∗p < 0.001). Error bars indicate standard deviations.

