Figure 3.

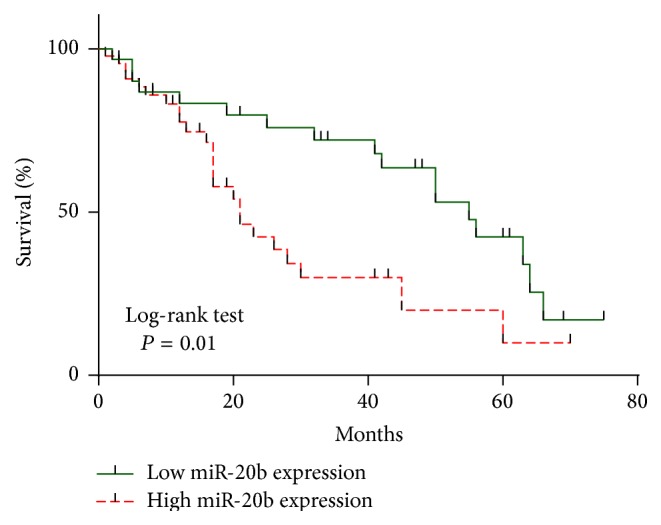
Kaplan-Meier survival curve of HCC patients. Patients in the high expression group had significantly poorer prognosis than those in low expression group, analyzed by log-rank tests which are indicated (P = 0.01).

Kaplan-Meier survival curve of HCC patients. Patients in the high expression group had significantly poorer prognosis than those in low expression group, analyzed by log-rank tests which are indicated (P = 0.01).