Figure 4.

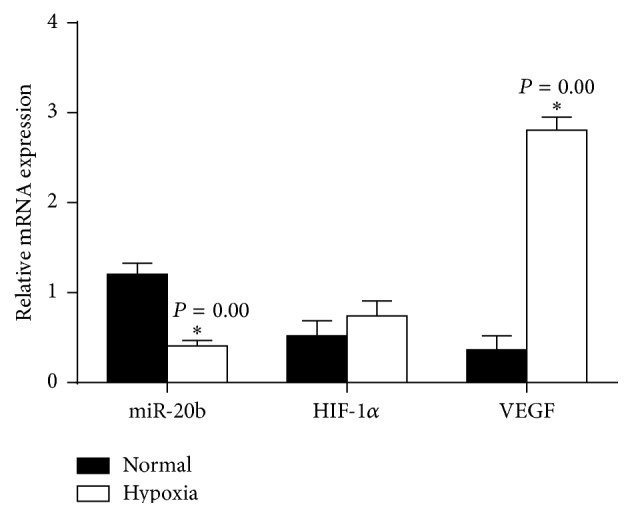
The levels of miR-20b and HIF-1α, VEGF expression after treatment of CoCl2 for 24 h. ∗∗ P < 0.01 compared with normal group.

The levels of miR-20b and HIF-1α, VEGF expression after treatment of CoCl2 for 24 h. ∗∗ P < 0.01 compared with normal group.