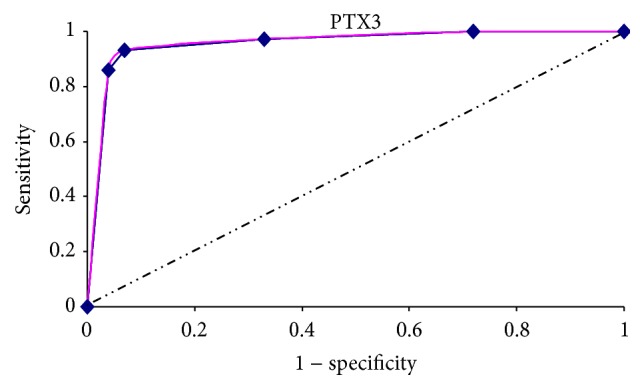
Figure 2.

ROC curve analysis was used to determine PTX3 cut-off point between lupus patients and healthy controls. Example of a receiver operating characteristic curve. Solid red: ROC curve; dashed line: chance level; vertical line: (J) maximum value of Youden's Index for the ROC curve.
