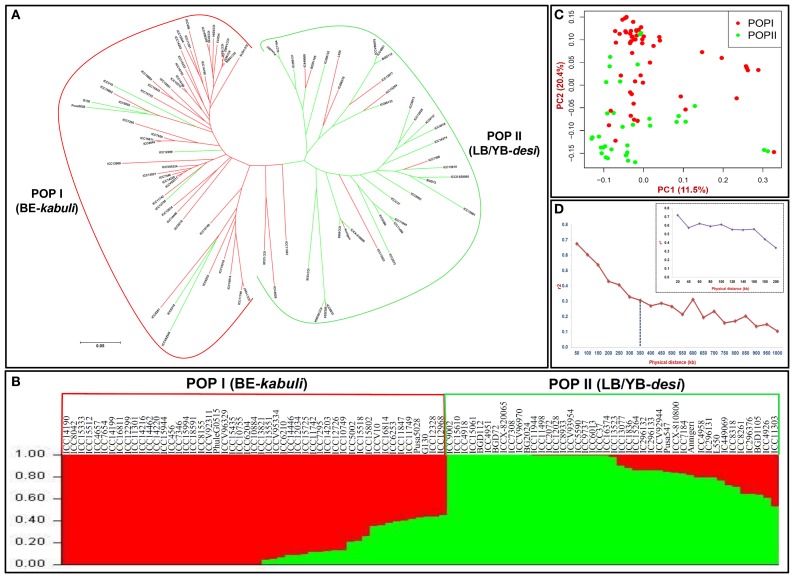
Figure 2.
(A) Unrooted phylogenetic tree (Nei's genetic distance), (B) Population genetic structure (optimal population number K = 2 with two diverse color) and (C) Principal component analysis (PCA) using 8837 genome-wide GBS- and candidate gene-based SNPs assigned 93 BE (beige) and LB/YB (light/yellow brown) seed coat color representing kabuli and desi chickpea accessions mostly into two major populations-POP I and POP II, respectively. In population structure, the accessions represented by vertical bars along the horizontal axis were classified into K color segments based on their estimated membership fraction in each K cluster. In PCA, the PC1 and PC2 explained 7.1 and 17.4% of the total variance, respectively. (D) LD decay (mean r2) measured in a population of 93 cultivated desi and kabuli chickpea accessions using 7488 SNPs physically mapped on eight kabuli chromosomes. The plotted curved line denotes the mean r2-values among SNP loci spaced with uniform 50 kb physical intervals from 0 to 1000 kb across chromosomes. The plotted line in uppermost indicates the mean r2-values among SNPs spaced with uniform 20 kb physical intervals from 0 to 200 kb on chromosomes.

