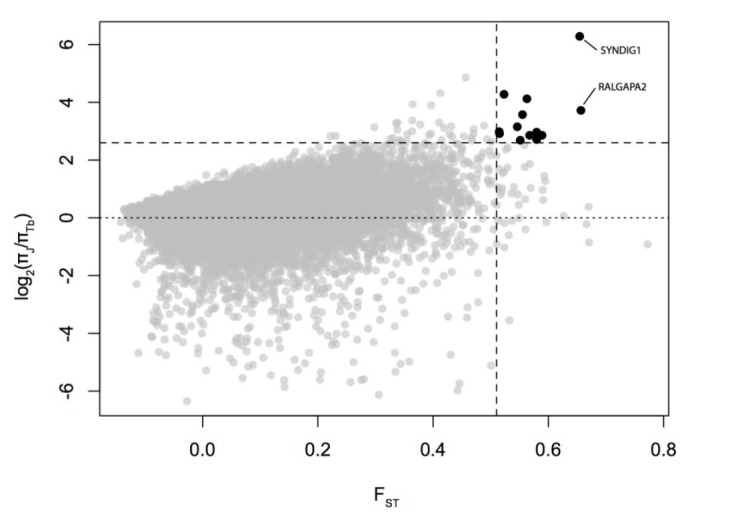
Figure 1.

Putative signatures of selective sweeps in the Thoroughbred population. Black dots depict potential candidates of top 0.1% (vertical dashed line) of FST as well as top 0.1% (horizontal dashed line) of the ratio of π in Thoroughbreds to that in Jeju breed. Dotted line depicts π in Thoroughbred being equal to that in Jeju breed.
