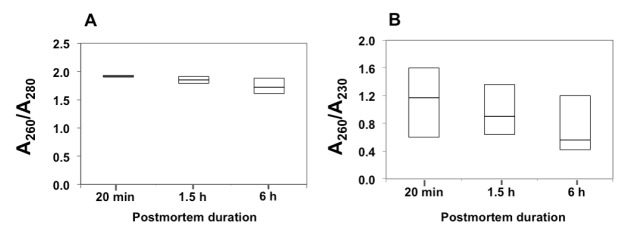
Figure 1.
Box plots illustrate relative absorbance at 260 nm to 280 nm (A260/A280) (A) and at 260 nm to 230 nm (A260/A230) (B) of chicken breast muscle collected at different postmortem time-points. The box represents interquartile range. The top and the bottom of the box represent minimum and maximum values, while the horizontal lines within the box indicate median. Statistical parameters were calculated from three biological replicates. No significant difference in the values of A260/A280 or A260/A230 was found among postmortem duration (p≥0.05).

