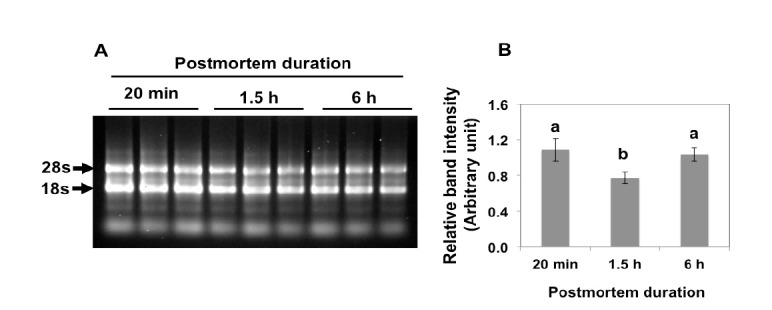
Figure 2.

RNA integrity assessment using 1% agarose electrophoresis. (A) Electrophoretic profiles of total RNA from chicken skeletal muscle obtained at different postmortem periods. In this figure, only electrophoretic patterns of three biological replicates were shown. (B) Histograms, constructed through densitometric analysis of electrophoretic results, represent mean±standard error of the mean of relative intensity of 28s rRNA bands to 18s rRNA bands calculated from six biological replicates. Different letters above the histograms indicate significant difference (p<0.05).
