
Figure 2. Fold-change of average peak areas of each discriminant feature.
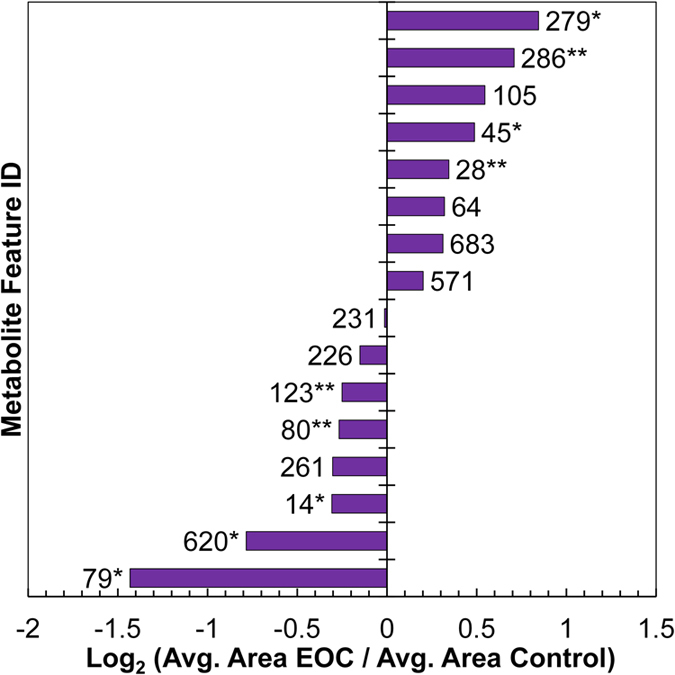
Positive values indicate higher levels of metabolite observed on average for EOC patients compared to control patients, while negative values indicate inverse relationship (*p < 0.05; **p < 0.10, Mann Whitney U test).