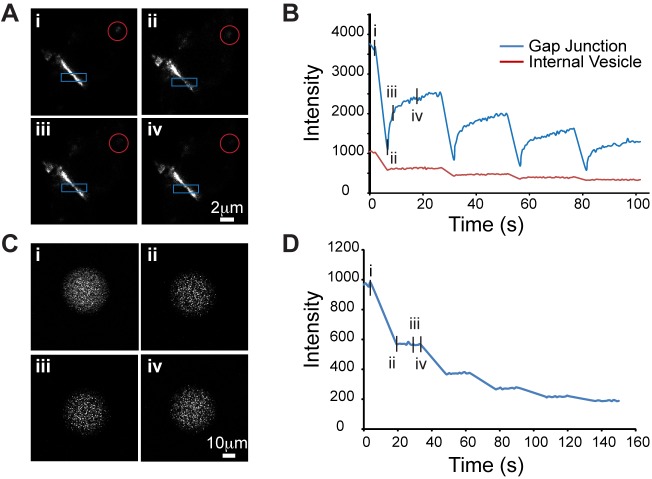
Fig. 8.
FRAP analysis of OG-labeled Cx36-Halo in HeLa cells. (A) Images of a gap junction prior to bleach (i) and at 0.5, 1.5 and 10.4 s post-bleach (ii–iv). The blue box is the bleached ROI and the red circle is an intracellular vesicle bleached at the same time. (B) Intensity profiles of the bleached ROIs: gap junction is the blue line; vesicle is the red line. (C) FRAP of an OG ligand droplet using the same bleaching parameters; images represent the time points indicated in A. (D) Intensity profile of droplet bleach.

