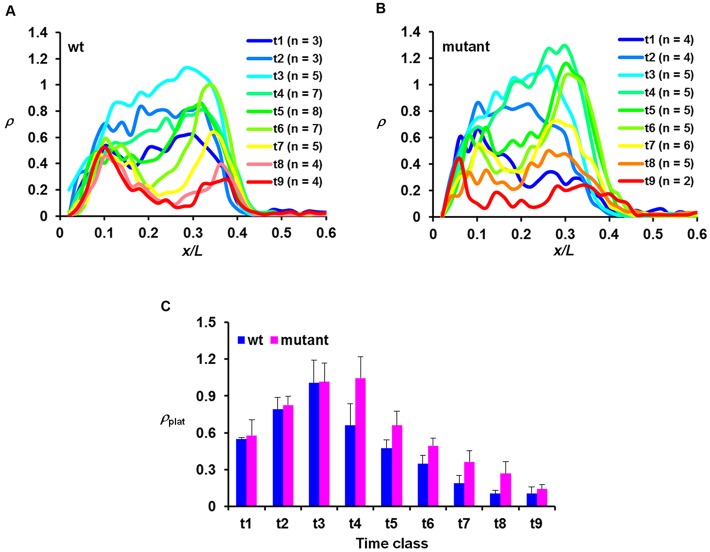
Fig. 4.
hb shutdown is delayed in the mutant embryo. (A,B) Mean ρ profiles for the indicated time classes from wt and mutant embryos. (C) Comparison of the mean ρplat values (with s.d.) for the indicated time classes between wt and mutant embryos. Time classes are ∼1 min intervals into nc14. The mean ρplat values are 0.55±0.01, 0.79±0.10, 1.01±0.18, 0.66±0.17, 0.47±0.07, 0.35±0.07, 0.19±0.07, 0.10±0.03 and 0.11±0.05 for wt and 0.58±0.13, 0.83±0.07, 1.02±0.15, 1.05±0.17, 0.66±0.12, 0.49±0.07, 0.36±0.09, 0.27±0.10 and 0.14±0.04 for mutant, for t1 to t9, respectively. P-values between wt and mutant embryos are 0.73, 0.63, 0.94, 3.4×10⁻³, 3.9×10⁻³, 4.2×10⁻³, 5.7×10⁻³, 1.4×10⁻² and 0.46 for t1 to t9, respectively. Note the difference between the time scales in this figure (∼1 min) and Fig. 2 (∼4 min). In addition, the active copies of the endogenous hb gene shown in this figure were detected by an intronic probe, whereas those of the intronless lacZ reporter transgene were detected by a coding sequence probe. As discussed recently (Liu and Ma, 2013a), unlike intronic probes, the use of coding sequence probes can cause the detected active sites to ‘linger’ for a period of time after transcription initiation/elongation near the promoter has been shut off.

