
Figure 1. Medial views of modulation of neural activity, distribution of GABAA receptors and the primary visual cortex (V1).
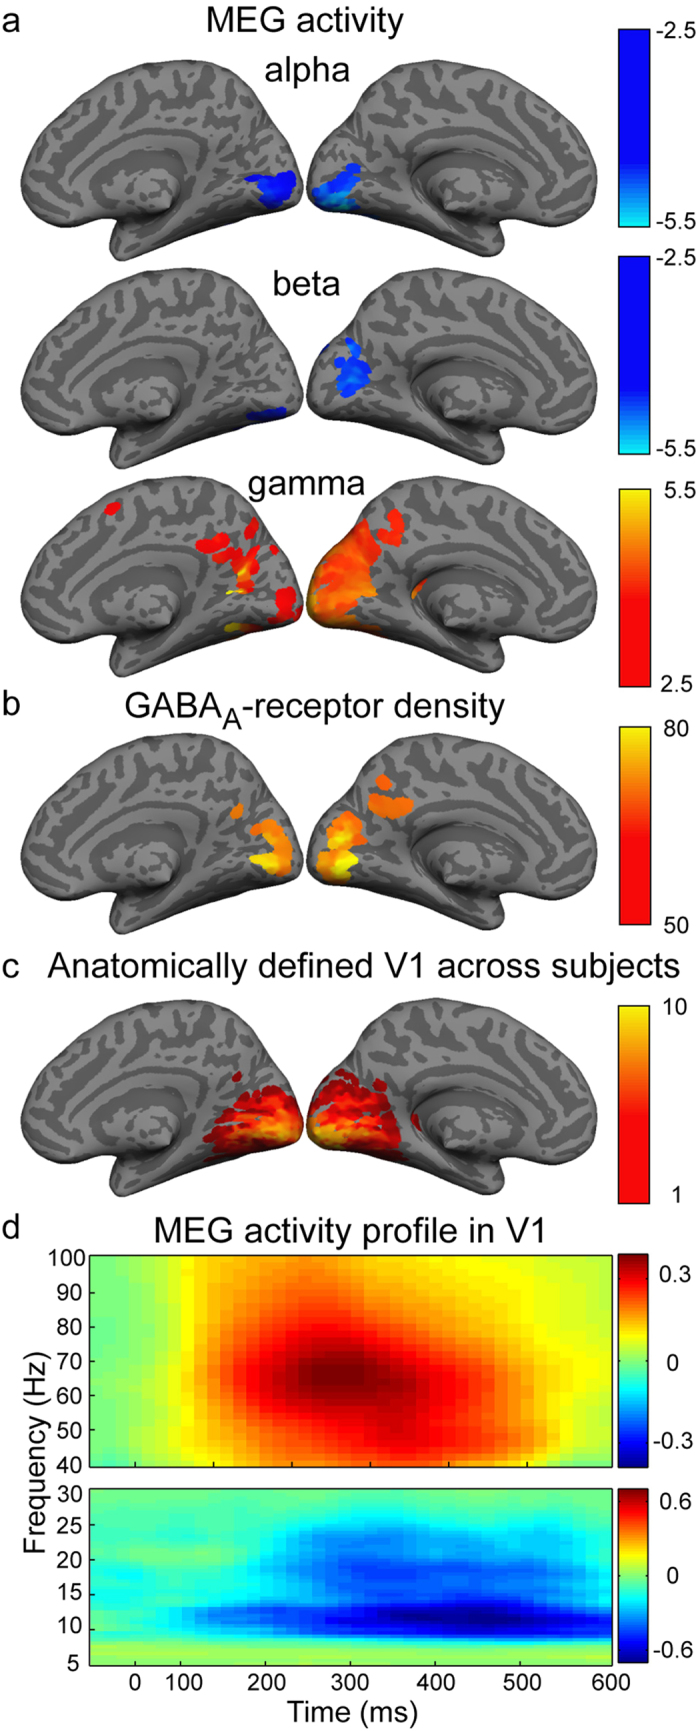
(a) Modulation of neural activity in the alpha-, beta- and gamma-bands with respect to baseline time-window (paired t-test, p < 0.005, uncorrected). (b) Cortical GABAA receptor density across subjects (threshold at mean + 1 SD). (c) Consistency of V1 in the template brain across subjects. (d) Group-level neural responses (normalized units) in the anatomically defined bilateral V1. The data are shown for the 10 subjects for whom both MEG and PET data were recorded successfully. Cortical-level visualization was performed using FreeSurfer software57.