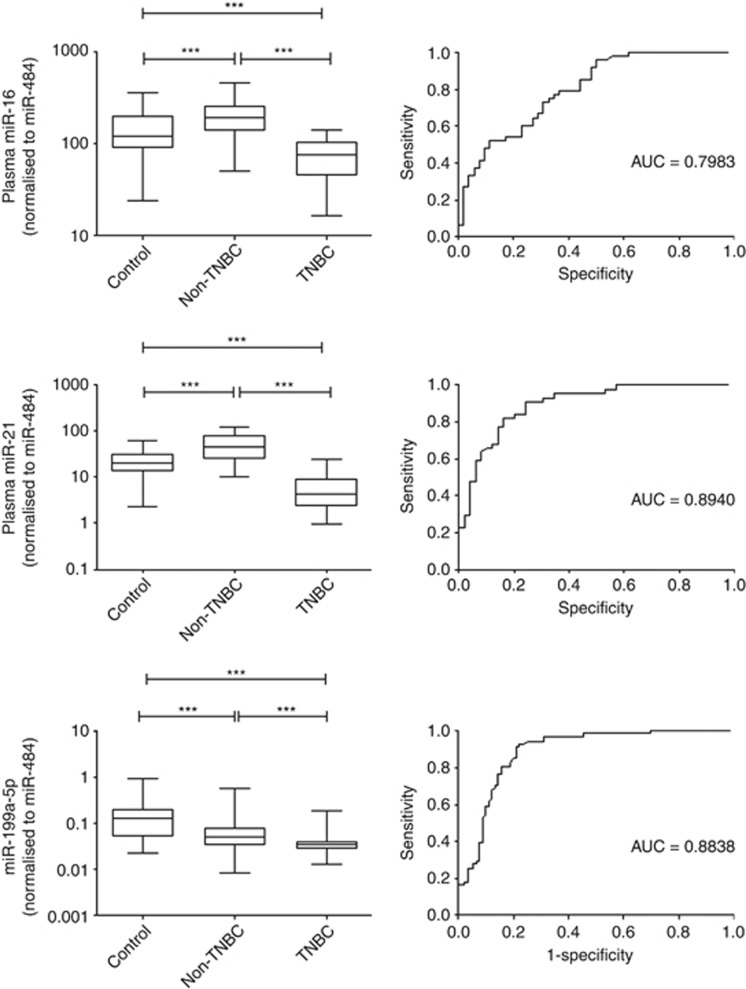
Figure 4.
Large scale validation of three miRNAs in a cohort of 252 patients. Box plot of plasma levels of miR-16 miR-21 and miR-199a-5p in TNBC patients. The expression of miRNAs was normalised to miR-484. The lines inside the boxes represent the medians. The boxes mark the interval between the 25th and 75th percentiles. The whiskers denote the interval between the 10th and 90th percentiles. Statistically significant differences were determined using Mann–Whitney tests. Receiver-operator characteristics (ROC) curve analysis of miRNAs to discriminate TNBC patients from healthy controls. ***P<0.001.

