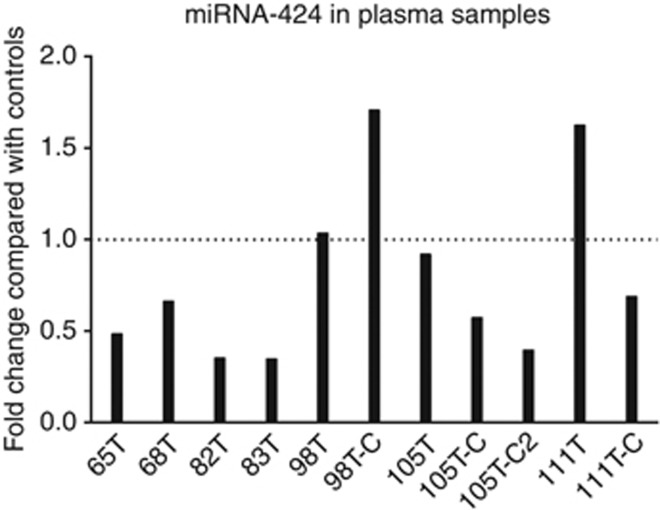
Figure 3.
miRNA-424 expression in plasma from patients with tongue SCC. Analysis of miRNA-424 levels in plasma samples from seven patients with tongue SCC compared with plasma from healthy individuals showing interindividual variation. The graph shows fold change when comparing tumour patients with the group of controls. All values were normalised against a geometric mean of miRNA-93, miRNA-103, miRNA-191 and miRNA-423. One follow-up sample was collected 3 months after treatment from two patients, and two follow-up samples were available from one patient, 3 and 6 months after treatment. These samples were labelled −C and −C2. The mean 2−(ΔCt) for plasma from patients with tumour was 0.105 and for healthy controls 0.144, P=0.343.

