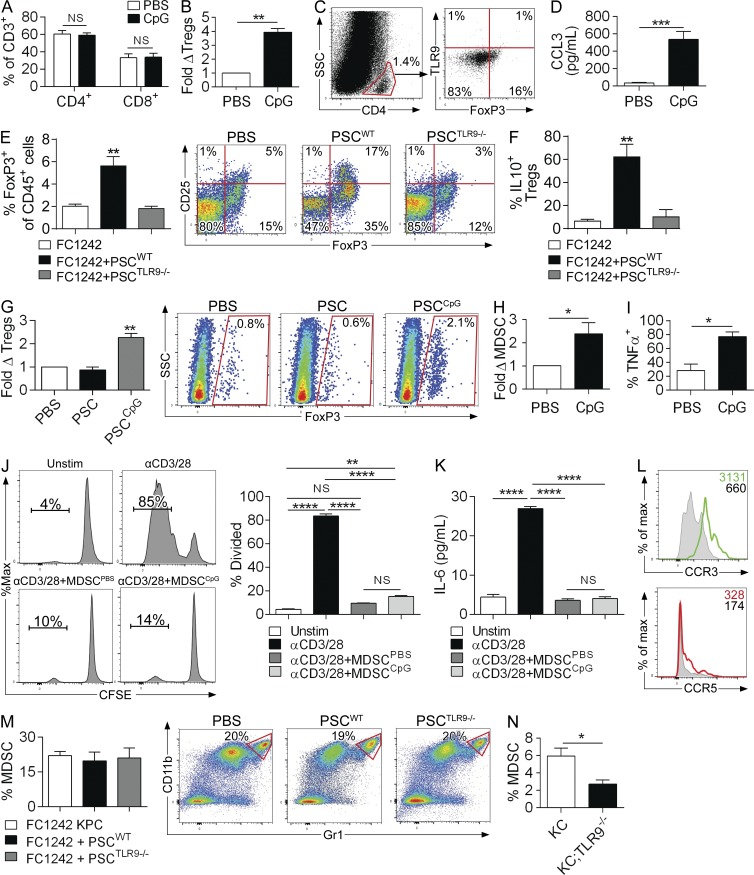
Figure 9.
TLR9 ligation recruits immune suppressive cellular subsets to the pancreatic tumor microenvironment. (A and B) 10-wk-old KC mice were administered CpG or PBS thrice weekly for 4 wk and the frequency of intrapancreatic CD4+ and CD8+ T cells determined by flow cytometry (n = 4/group). (B) Similarly, the relative number of CD45+CD3+CD4+FoxP3+CD25+ T reg cells was determined in PBS- and CpG-treated KC pancreata. (C) CD4+ pancreatic T lymphocytes in KC mice were gated and tested for coexpression of FoxP3 and TLR9. (D) 10-wk-old KC mice were treated with PBS or CpG for 4 wk and CCL3 levels in pancreatic lysates were quantified using a cytometric bead array (n = 3/group). (E and F) WT mice were treated with an intrapancreatic injection of FC1242 cells alone, FC1242 + WT PSCs, or FC1242 + TLR9−/− PSCs (n = 4/group). (E) The percentage of CD3+CD4+FoxP3+ pancreatic leukocytes among all CD45+ leukocytes was calculated. Representative dot plots showing CD25 and FoxP3 coexpression on CD4+ T cells are shown for each experimental group. (F) IL-10 expression was determined on CD4+CD25+FoxP3+ T reg cells by intracellular cytokine analysis. (G) CD4+ splenic T cells from WT mice were FACS-sorted and incubated alone or with conditioned media from PBS- or CpG-treated PSCs. On day 5, T cells were then tested for expression of FoxP3. Representative data and averages of quadruplicates are shown. (H and I) 10-wk-old KC mice were administered CpG or PBS thrice weekly for 4 wk (n = 4/group). (H) The percentage of CD45+CD11b+Gr1+ MDSCs in each cohort was determined by flow cytometry. (I) Similarly, the production of TNF by intrapancreatic MDSC was quantified by intracellular cytokine staining in CpG- and PBS-treated KC mice. (J and K) Splenic T cells labeled with CFSE were cultured without stimulation, stimulated with αCD3 + αCD28 mAbs alone, αCD3 + αCD28 mAbs + MDSC harvested from PBS-treated KC mice, or αCD3 + αCD28 mAbs + MDSC harvested from CpG-treated KC mice (5:1 T cell/MDSC ratio). (J) T cell proliferation was determined by dissolution of CFSE. (K) IL-6 was measured in cell culture supernatant by cytometric bead array. Representative data and averages of triplicates are shown. This experiment was performed twice. (L) CD45+CD11b+Gr1+ cells from 3-mo-old KC mice were tested for expression of CCR3 and CCR5 by flow cytometry. Shaded histograms correspond to isotype controls. (M) WT mice were administered an intrapancreatic injection of FC1242 cells alone, FC1242 + WT PSCs, or FC1242 + TLR9−/− PSCs (n = 4/group). 3 wk later, the percentage of CD11b+Gr1+ MDSC among intratumoral CD45+ cells was assessed by flow cytometry. Representative dot plots are shown for each experimental group (p = ns for all comparisons). (N) The percentage of CD11b+Gr1+ intrapancreatic MDSC among CD45+ cells were quantified by flow cytometry in 3-mo-old KC and KC;TLR9−/− mice (n = 4/group). All data were reproduced in three separate experiments (*, P < 0.05; **, P < 0.01; ***, P < 0.001; ****, P < 0.0001 using the Student’s t test or ANOVA).

