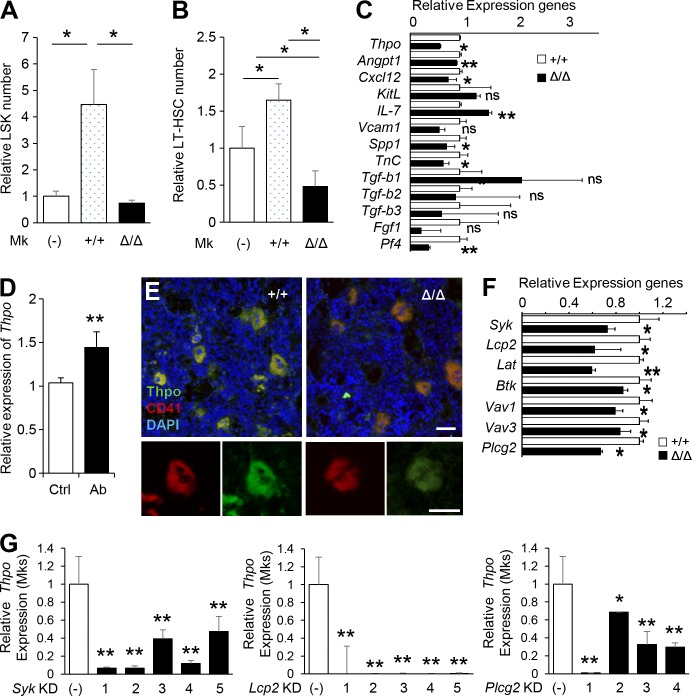
Figure 3.
CLEC-2–positive Mks produce Thpo. (A and B) Effect of 3 d of co-culture with Mks from Δ/Δ or +/+ mice on LSK cells (A) and LT-HSCs (B). Means ± SD. n = 4; two independent experiments. *, P < 0.05 by Tukey’s test. (C) Relative levels of niche factor (Thpo, Angpt1, Cxcl12, KitL, IL-7, Vcam1, Spp1, TnC, Tgf-b1, Tgf-b2, Tgf-b3, Fgf1, and Pf4) transcripts in Mks from Δ/Δ mice compared with +/+ mice. (D) Relative levels of Thpo transcripts were significantly up-regulated in cultured Mks treated with a CLEC-2 stimulatory antibody. (E) IHC of BM from +/+ and Δ/Δ mice. Mks, which are CD41, exhibit lower Thpo levels in CLEC-2–deficient Mks. Magnification of a representative Mk is shown in the bottom panels. Bars: (top) 50 µm; (bottom) 100 µm. (F) Gene expression of CLEC-2 downstream pathway molecules in Mks from +/+ and Δ/Δ mice. (G) Knockdown of Syk, Lcp2, and Plcg2 results in reduced expression of Thpo transcript in Mks. (C, D, F, and G) Means ± SD. n = 4; two independent experiments. ns, P > 0.05; *, P < 0.05; and **, P < 0.01 by Student’s t test.

