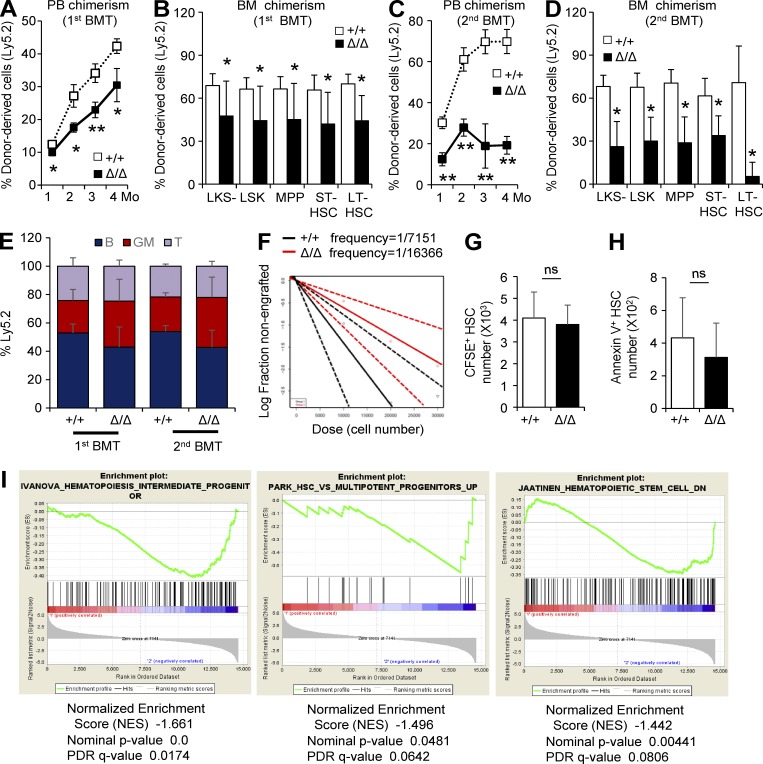
Figure 5.
HSCs from Clec2MkΔ/Δ mice exhibit reduced repopulation capacity. (A and C) Percentage of donor-derived cells (Ly5.2) in PB after the first and second BMT at the indicated time intervals (in months). (B and D) Percentage of donor-derived cells (Ly5.2) in BM HSPCs after the first and second BMT at the indicated time intervals (in months). (A–D) Means ± SEM. n = 6; two independent experiments. *, P < 0.05; and **, P < 0.01 by Student’s t test. (E) Lineage composition of Ly5.2 MNCs in recipient mice. Means ± SEM. n = 6; two independent experiments. P > 0.05 in all groups by Student’s t test. (F) Extreme limiting dilution assay of BM MNCs from Δ/Δ and +/+ mice. n = 7; two independent experiments. P = 0.0432 by Pearson’s χ2 test. (G) Number of CFSE staining LT-HSCs from Δ/Δ and +/+ mice homing to the BM 24 h after BMT. Note that no significant difference was present in homing capacity of HSCs from Δ/Δ and +/+ mice. (H) Number of Annexin V+ HSCs in Δ/Δ and +/+ mice. (G and H) Means ± SD. n = 4; two independent experiments. ns, P = 0.677 (G) or P = 0.48 (H) by Student’s t test. (I) Gene set enrichment analysis of LT-HSCs from Δ/Δ and +/+ mice (n = 10). Genes expressed by intermediate and multipotent progenitors were significantly up-regulated in LT-HSCs from Δ/Δ mice (plots are second and third from left). Statistical analysis is as shown in figure.

