Figure 7.
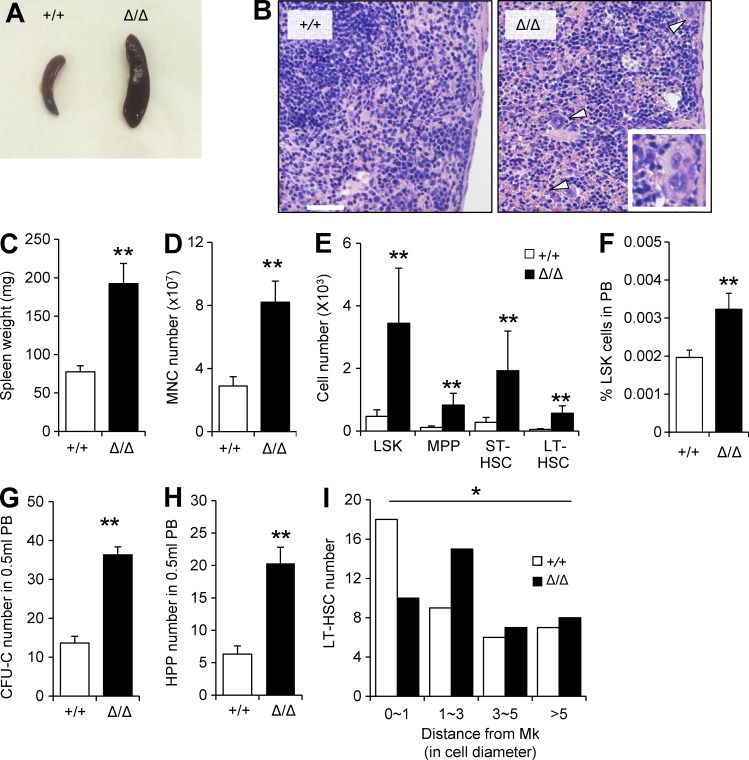
Clec2MkΔ/Δ mice exhibit extramedullary hematopoiesis and elevated mobilization of HSCs into PB. (A and B) Gross appearance (A) and hematoxylin and eosin staining (B) of spleens from +/+ and Δ/Δ mice. Arrowheads indicate the presence of Mks in Clec2Mk+/+ spleens. Magnification of an Mk is shown in the inset. Bar, 200 µm. (C–E) Analysis of spleen of Δ/Δ and +/+ mice. Spleen weight (C), total MNC number (D), and absolute populations of various HSPC fractions (E) are significantly higher in spleens of Clec2MkΔ/Δ compared with Clec2Mk+/+ mice. (F–H) Percentage of LSK cells (F), CFU-C number (G), and HPP-CFC number (H) in PB of +/+ and Δ/Δ mice. (C–H) Means ± SD. n = 6; two independent experiments. **, P < 0.01 by Student’s t test. (I) Quantitation of distance of LT-HSCs from Mks in +/+ and Δ/Δ mice. Means ± SD. n = 6; two independent experiments. *, P = 0.038 by Tukey’s test.

