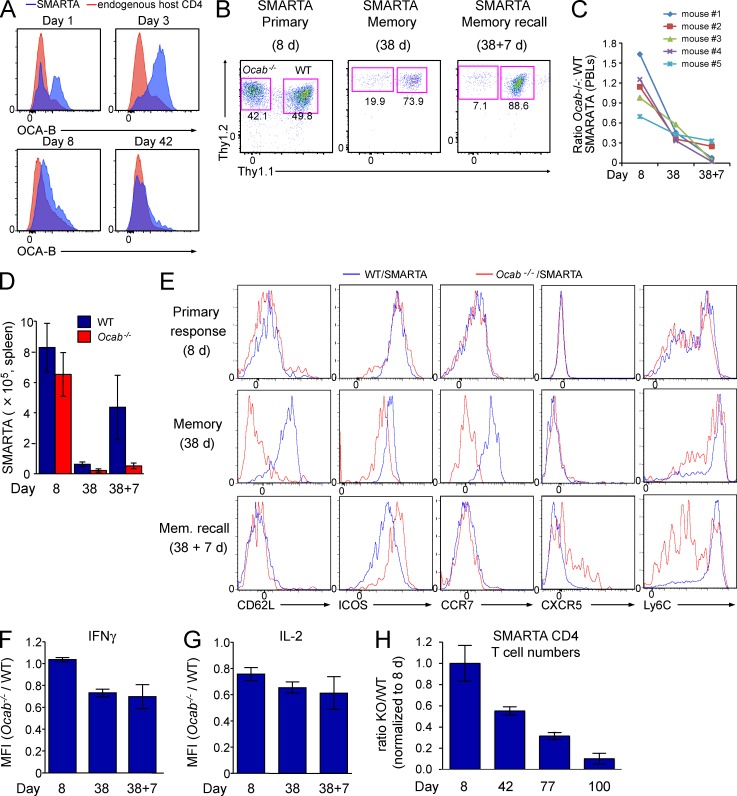
Figure 5.
OCA-B is required for robust memory CD4+ T cell function in vivo. (A) WT SMARTA (Thy1.1+) T cells were transferred into Thy1.2+ mice, which were infected with LCMV 1 d later. Splenocytes were harvested at the indicated time points after infection. Cells were stained with OCA-B antibodies and subjected to flow cytometry. Enrichment relative to host T cells is shown. (B) Ocab−/− SMARTA (Thy1.2+Ly5.2+) and WT control SMARTA (Thy1.1+Thy1.2+Ly5.2+) T cells were co-transferred into Ly5.1+ mice, which were infected with LCMV. Frequencies of each population were tracked at the indicated time points. Representative plots, gated on donor SMARTA cells, indicate the relative distribution of WT and Ocab−/− SMARTA T cells in the spleen at the peak of the primary response (Primary, 8 d after infection), after the establishment of memory (Memory, 38 d after infection), or 7 d after rechallenge with Lm-gp61 (Memory recall). (C) For each time point, the ratio of Ocab−/− to WT SMARTA blood cells was calculated for each of five mice. (D) For each time point, total splenic CD4+ Ocab−/− and WT SMARTA T cell numbers were averaged and plotted. Three animals were sacrificed at days 8 and 38, and four animals at day 38 + 7. Error bars depict ±SD. (E) Cells isolated as in D were stained using the indicated antibodies and analyzed by flow cytometry. Cells were gated for viability and CD4 expression. (F) The ratio of IFNγ mean fluorescence intensities (MFIs) in WT and Ocab−/− SMARTA T cells was calculated from each of five mice and plotted as mean ± SD. Cells were stimulated with peptide/brefeldin-A ex vivo before intracellular cytokine staining. (G) Similar calculation (as in F) using IL-2 MFIs. (H) WT (Thy1.1+) and Ocab−/− (Thy1.1+Thy1.2+) SMARTA cells were combined and adoptively transferred into Thy1.2 recipients. After LCMV infection, cohorts of four mice were sacrificed at 8, 42, 77, and 100 d. T cell numbers at peak response were averaged. For each genotype, T cell counts were divided by the number at peak response and averaged. Error bars depict ± SD.

