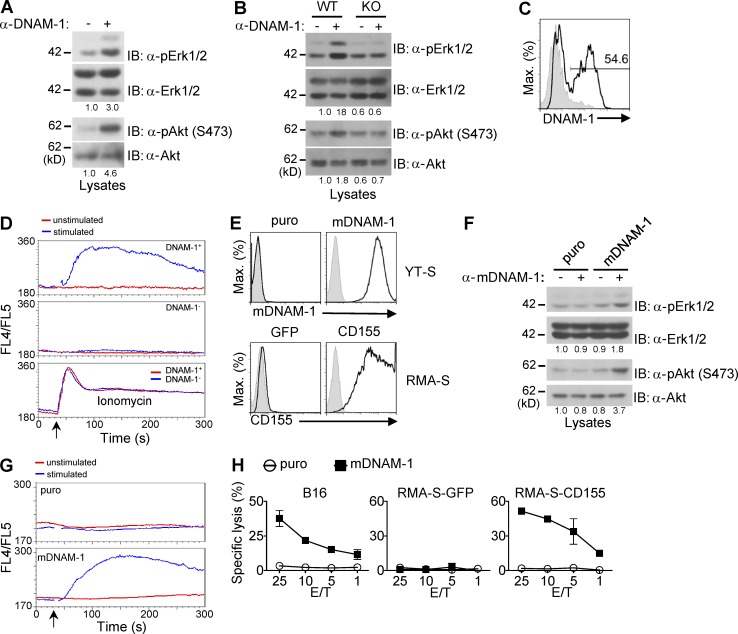
Figure 1.
Impact of engagement of DNAM-1 on activation of Erk, Akt, and calcium fluxes in NK cells. (A) IL-2–activated NK cells from WT mice were stimulated for 2 min with anti–mouse DNAM-1 (480.2), followed by secondary antibodies (+) or secondary antibodies alone (-). Activation of Erk and Akt was assessed by immunoblotting with antibodies against phosphorylated Erk (α-pErk) or Akt (α-pAkt). Quantitation of relative phosphorylation is shown at the bottom. Representative of at least n = 3. (B) Same as A, except that WT and DNAM-1–deficient (KO) mice were analyzed. Representative of at least n = 3. (C) Expression of DNAM-1 on splenic NK cells (defined as NK1.1+CD3− cells) was analyzed by flow cytometry. Isotype control is shown as filled histograms. Percentage of DNAM-1+ NK cells is indicated. Representative of at least n = 5. (D) IL-2–activated NK cells were labeled with FITC-conjugated anti–mouse DNAM-1 and loaded with Indo-1, followed by secondary antibodies (stimulated) or not (unstimulated). The changes of intracellular calcium (monitored as FL4/FL5 ratio) in DNAM-1+ (top) and DNAM-1− (middle) NK cells were analyzed. Cells were treated with ionomycin (bottom) as positive control. Arrow indicates when the secondary antibodies or ionomycin was added. Representative of n = 5. (E) Expression of mouse DNAM-1 (top) and mouse CD155 (bottom) on transfected or retrovirus-transduced YT-S cells and RMA-S cells, respectively, was determined by flow cytometry. Cells expressing the puromycin resistance marker (puro) or GFP alone were used as control. Isotype control is shown as filled histogram. Representative of at least n = 3. (F) YT-S cells expressing mouse DNAM-1 (mDNAM-1) or puromycin-resistant marker (puro) alone were stimulated with anti–DNAM-1, and activation of Erk and Akt was assessed, as detailed for A. Representative of n = 5. (G) YT-S cells expressing mouse DNAM-1 (mDNAM-1) or puromycin-resistant marker (puro) alone were loaded with Indo-1. They were then stimulated with anti–mouse DNAM-1, followed by secondary antibodies (stimulated), or secondary antibodies alone (unstimulated). Changes of intracellular calcium were monitored as FL4/FL5 ratio. Arrow indicates when the secondary antibodies or ionomycin was added. Representative of n = 3. (H) Natural cytotoxicity of YT-S cells expressing mouse DNAM-1 (mDNAM-1) or puromycin resistant marker (puro) alone was tested in a 51Cr-release assay at indicated effector-to-target (E/T) ratio. The target cells used were B16 or RMA-S expressing or not expressing mouse CD155. SDs of duplicate values are depicted by error bars. Representative of n = 3.

