Figure 4.
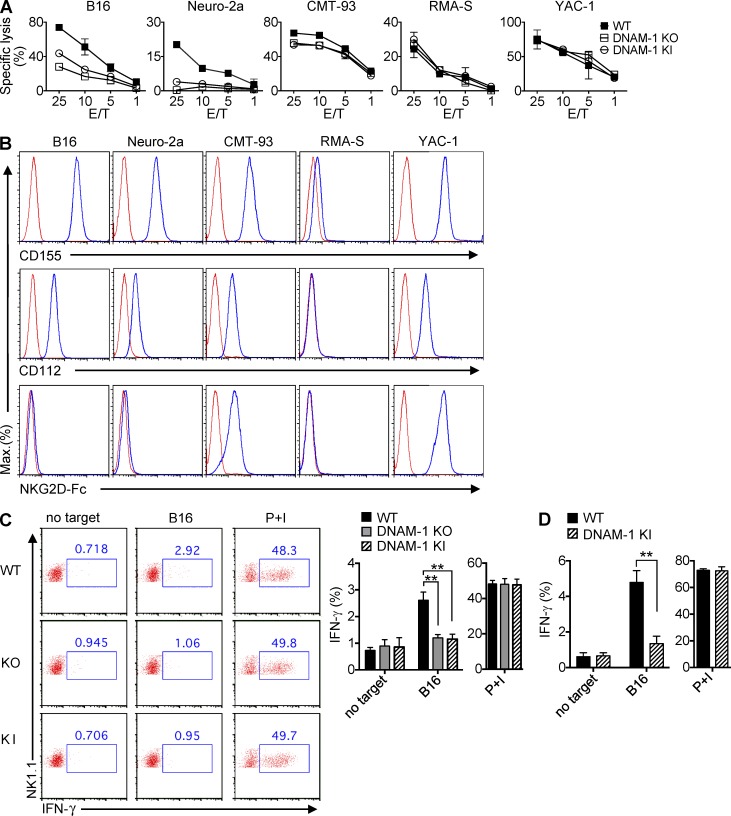
Cytotoxicity and cytokine production by DNAM-1 Y319F mouse NK cells. (A) Natural cytotoxicity of NK cells from WT, DNAM-1 KO, or DNAM-1 KI mice was tested in a 51Cr-release assay, using as targets B16, Neuro-2a, CMT-93, RMA-S, or YAC-1. SDs of duplicate values are depicted by error bars. Representative of n = 5. (B) Expression of ligands for DNAM-1 and NKG2D on target cells. Expression of the DNAM-1 ligands, CD155 and CD112, and NKG2D ligands (detected using an NKG2D-Fc fusion protein) was assessed by flow cytometry. Isotype controls are shown as the red line. Representative of n = 3. (C and D) Splenocytes from poly(I:C)-primed mice were incubated with B16 for 6 h. Production of IFN-γ in total NK cells (NK1.1+CD3−; C) or DNAM-1+ NK cells (NK1.1+CD3−DNAM-1+; D) was analyzed by intracellular staining. Splenocytes without any target or splenocytes stimulated with phorbol myristate acetate and ionomycin (PMA/iono) served as controls. Representative dot plots are shown in C (left). Average values with SDs of triplicates from one representative experiment are depicted in C (right) and D. Unpaired Student’s t tests were performed. **, P < 0.01. Representative of n = 3 (C and D).

