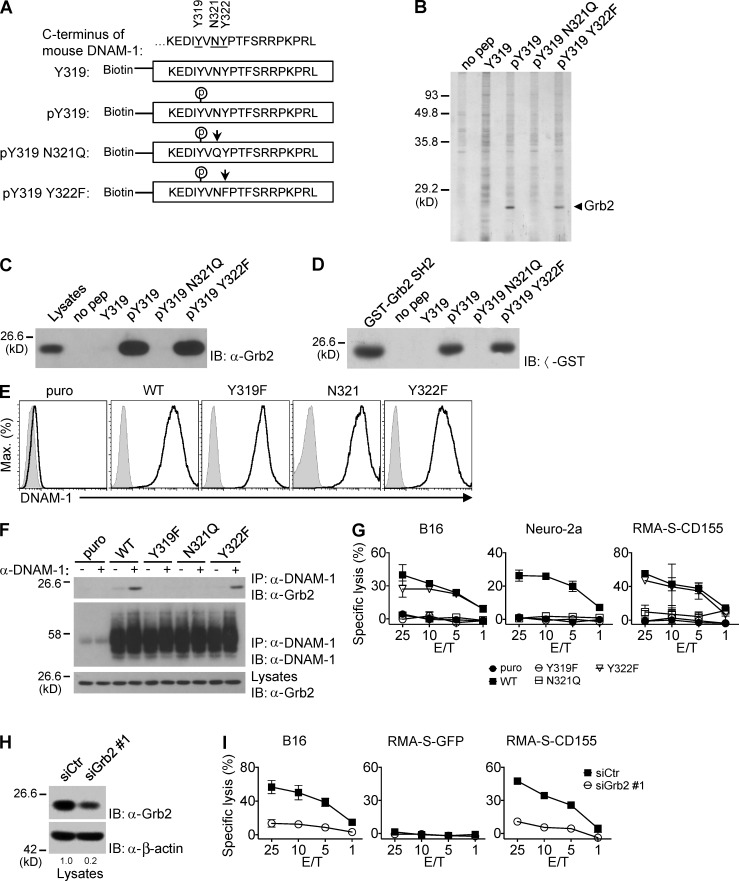
Figure 5.
DNAM-1 promotes NK cell activation via a tyrosine- and asparagine-based motif that recruits Grb2. (A) Biotinylated peptides corresponding to the carboxyl-terminus of mouse DNAM-1 were synthesized, with (pY319) or without (Y319) phosphorylation at tyrosine 319. In some peptides, additional mutations were introduced: N321Q, in which asparagine 321 was mutated to glutamine and Y322F, in which tyrosine 322 was mutated to phenylalanine. The mutated residues are indicated by arrows. (B) DNAM-1 peptides were coupled to agarose beads and used to capture binding proteins from lysates of YT-S cells. Bound proteins were identified by silver staining of protein gels. Agarose beads alone (no pep) served as control. The migration of molecular mass markers is indicated on the left. Representative of n = 4. (C) DNAM-1 peptides were incubated with lysates of YT-S cells and bound proteins were probed by immunoblotting with anti-Grb2 antibodies. Representative of n = 4. (D) DNAM-1 peptides were incubated with lysates of bacteria expressing the indicated glutathione-S-transferase (GST) fusion proteins. Nonpurified GST-Grb2 SH2 fusion proteins served as control. Representative of n = 2. (E and F) YT-S cells were transfected with cDNAs encoding WT, Y319F, N321Q, or Y322F mouse DNAM-1, or the puromycin resistant marker (puro) alone. Expression of mouse DNAM-1 was tested by flow cytometry. Isotype controls are shown as filled histogram (E). Representative of n = 4. They were then stimulated (+) or not (−) with anti–DNAM-1 antibodies and the relevant secondary antibody (F). The association of DNAM-1 with Grb2 was detected by immunoblotting of DNAM-1 immunoprecipitates with anti-Grb2 antibodies. Migration of heavy chain of IgG is shown on the left. Representative of n = 3. (G) The YT-S cells described in Fig. 5 E were tested for natural cytotoxicity, as detailed for Fig. 1 H. SDs of duplicate values are depicted by error bars. Representative of n = 3. (H and I) YT-S cells expressing WT mouse DNAM-1 were transfected with Grb2-specific siRNAs (siGrb2 #1) or irrelevant siRNAs (siCtr) as control. Down-regulation of Grb2 expression was assessed by immunoblotting with anti-Grb2 (H). Cells were also tested for natural cytotoxicity, as detailed for Fig. 1 H (I). SDs of duplicate values are depicted by error bars. Quantitation of relative protein expression is shown at the bottom (H). Representative of n = 4.

