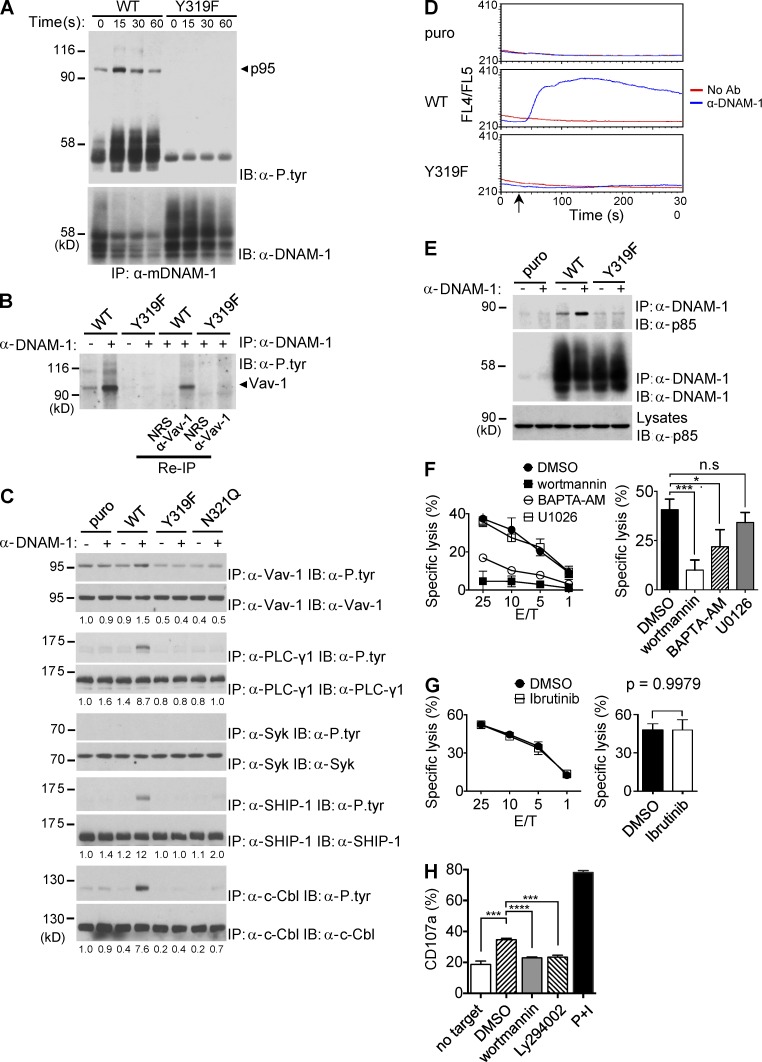
Figure 6.
The tyrosine- and asparagine-based motif couples DNAM-1 to multiple effectors. (A) YT-S cells expressing WT or Y319F mouse DNAM-1 were stimulated for the indicated times with anti–DNAM-1 and the relevant secondary antibody. DNAM-1 was then immunoprecipitated from cell lysates, and DNAM-1–associated proteins were detected by immunoblotting with anti-phosphotyrosine antibodies (α-P.tyr). The positions of DNAM-1 and p95 are indicated on the right. Migration of prestained molecular weight markers and heavy chain of IgG is shown on the left. It is notable that the amount of DNAM-1 recovered from cells expressing WT DNAM-1, but not DNAM-1 Y319F, was diminished upon anti–DNAM-1 stimulation. This finding likely indicated that signaling-competent DNAM-1 became detergent-insoluble upon stimulation. Representative of n = 4. (B) YT-S cells expressing the indicated variants of DNAM-1 were stimulated for 15 s with anti–DNAM-1 antibodies and the relevant secondary antibody. After extensive washing, eluates of DNAM-1 immunoprecipitates were reimmunoprecipitated with anti-Vav-1 or normal rabbit serum (NRS). Tyrosine phosphorylated proteins were detected by anti-phosphotyrosine immunoblotting. Representative of n = 3. (C) YT-S cells expressing the indicated variants of DNAM-1 or the puromycin resistance marker (puro) alone were stimulated with anti–DNAM-1 followed by the relevant secondary antibodies. Lysates were then immunoprecipitated with antibodies against the specified substrates and tyrosine phosphorylation was analyzed by immunoblotting with α-P.tyr. Quantitation of relative phosphorylation is shown at the bottom. Representative of at least n = 3. (D) YT-S cells expressing the indicated variants of DNAM-1 or the puromycin resistance marker (puro) alone were stimulated with anti–DNAM-1 antibodies and the relevant secondary antibody. Changes in intracellular calcium were analyzed as described for Fig. 1 G. Representative of n = 3. (E) YT-S cells expressing the indicated variants of DNAM-1 or the puromycin resistance marker (puro) alone were stimulated for 15 s with anti–DNAM-1 antibodies and the relevant secondary antibody. DNAM-1 was then immunoprecipitated and its association with p85 was detected by immunoblotting with anti-p85. Representative of n = 3. (F and G) YT-S cells expressing WT mouse DNAM-1 were treated with wortmannin (0.1 µM), 1,2-bis(2-aminophenoxy)ethane-N,N,N′,N′-tetraacetic acid tetrakis(acetoxymethyl ester; BAPTA-AM; 40 µM), U0126 (1 µM), ibrutinib (10 nM), or dimethysulfoxide (DMSO) alone as control, and their capacity to kill RMA-S-CD155 cells was assessed in a 51Cr-release assay (left). Average values at the 25:1 E/T ratio from 5 independent experiments are shown on the right. Representative of n = 5 (F) or n = 3 (G). SDs of duplicate values are depicted by error bars. Unpaired Student’s t tests were performed. n.s., not statistically significant. *, P < 0.05; ***, P < 0.001. (H) Splenocytes from WT mice were stimulated with B16 cells in the presence of the indicated compounds, as detailed for H. Expression of CD107a on DNAM-1+ NK cells (NK1.1+CD3−DNAM-1+) was analyzed by flow cytometry. Splenocytes alone or splenocytes stimulated with phorbol myristate acetate and ionomycin (PMA/iono) served as controls. Average values with SDs of triplicate values from one representative experiment are depicted. Unpaired Student’s t tests were performed. ***, P < 0.001; ****, P < 0.0001. Representative of n = 3.

