Figure 7.
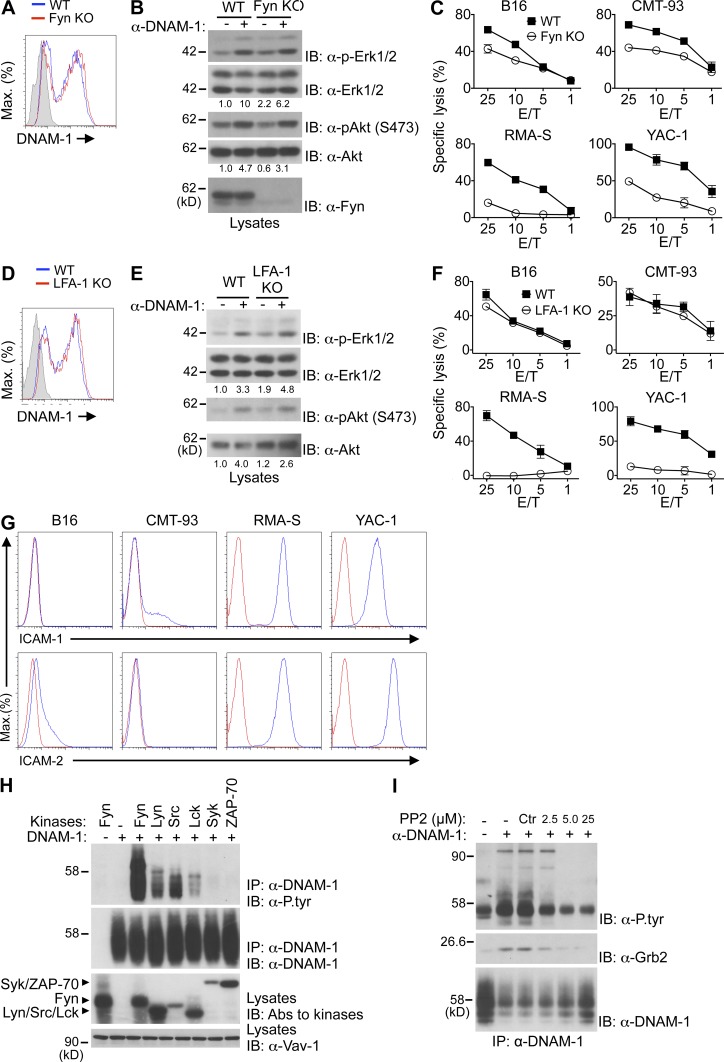
Role of Fyn and LFA-1 in DNAM-1 signaling. (A) Expression of DNAM-1 was analyzed on NK cells (NK1.1+CD3− splenocytes) from WT and Fyn-deficient (KO) mice. Isotype control is shown as filled histogram. Representative of n = 4. (B) NK cells from the indicated mice were stimulated for 2 min with anti–DNAM-1 antibodies and the relevant secondary antibody. Phosphorylation of Erk and Akt was assessed as detailed for Fig. 1 A. Quantitation of relative phosphorylation is shown at the bottom. Representative of n = 2. (C) Natural cytotoxicity of NK cells toward a variety of targets was tested in a 51Cr-release assay at indicated effector-to-target (E/T) ratio. SDs of duplicate values are depicted by error bars. Representative of n = 4. (D–F) Same as A–C, except that WT and LFA-1–deficient (KO) mice were analyzed. Representative of n = 3. (G) Expression of LFA-1 ligands on the indicated targets was determined by flow cytometry. Red line, isotype control. Representative of n = 2. (H) Mouse DNAM-1 was coexpressed with the indicated protein tyrosine kinases (PTKs) in Cos-1 cells. DNAM-1 was then immunoprecipitated and probed by immunoblotting with anti-phosphotyrosine (α-P.tyr) antibodies. Expression of PTKs was detected by probing total cell lysates with a cocktail of antibodies against the various PTKs. Representative of n = 3. (I) YT-S cells expressing mouse DNAM-1 were stimulated for 15 s with anti–DNAM-1 and the relevant secondary antibodies, in the absence or in the presence of the indicated concentrations of the Src family kinase inhibitor, PP2. DNAM-1 then was recovered from cell lysates by immunoprecipitation and probed by immunoblotting with anti-phosphotyrosine (α-P.tyr) or anti-Grb2 antibodies. Treatment with DMSO alone served as control (Ctr). The migration of molecular mass markers is indicated on the left. Representative of n = 3.

