Figure 8.
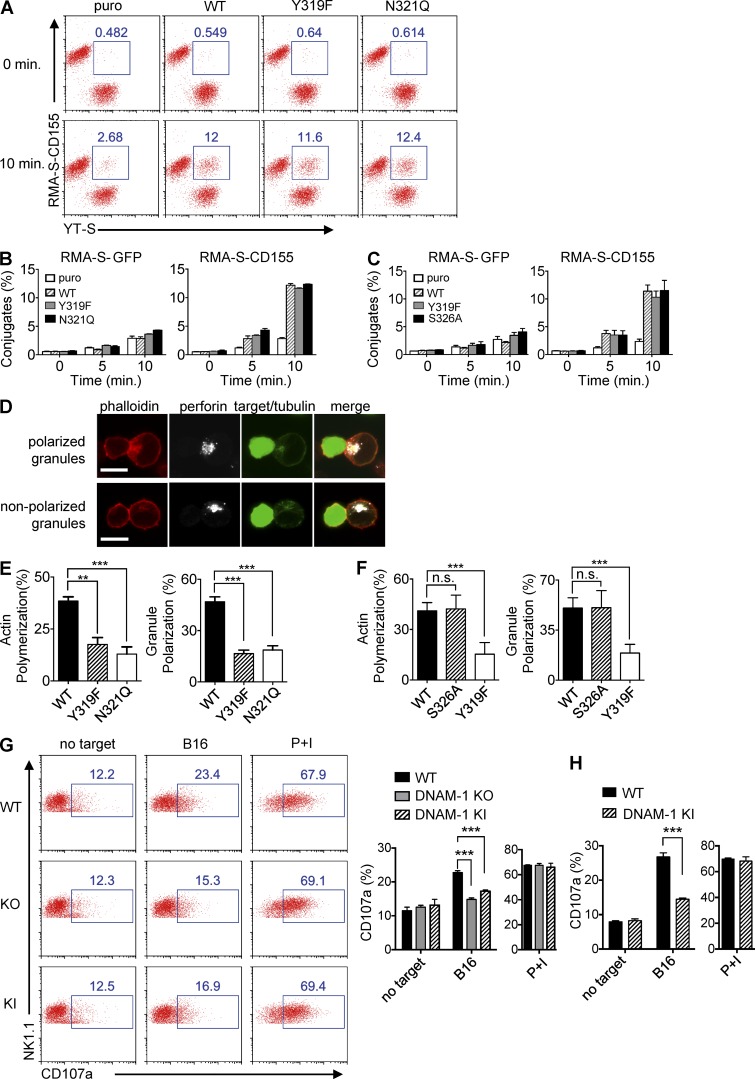
Impact of DNAM-1 signaling on conjugate formation, actin polymerization, and granule polarization. (A–C) The indicated derivatives of YT-S cells (labeled with Brilliant Violet 421-conjugated anti–human NKp46) were incubated with RMA-S-GFP or RMA-S-CD155 (labeled with Alexa Fluor 647–conjugated anti–mouse SLAM). Formation of conjugates (identified as NKp46+SLAM+) at the indicated times was examined by flow cytometry. A representative experiment is shown in A. The percentages of conjugates formed are indicated at the top. Statistical analysis of one representative experiment with SD of duplicate values is shown in B and C. Representative of at least n = 3. (D–F) Derivatives of YT-S cells and CellTrace violet-loaded RMA-S-CD155 cells were incubated for 30 min, loaded on poly-L-lysine–coated slides, and stained with phalloidin, anti-perforin, and anti-tubulin. Conjugates were analyzed by confocal microscopy. Staining of representative conjugates in which cytotoxic granules of YT-S cells were polarized or nonpolarized toward the synapse are shown in D. Bars, 10 µm. Percentages of conjugates in which YT-S cells displayed polymerized actin near the synapse or polarized granules are shown in E and F. For each YT-S derivative, >100 conjugates were analyzed. Averages of four values for each cell type pooled from two independent experiments are depicted in E and F. SDs are shown by error bars. Unpaired Student’s t tests were performed. n.s., non significant. **, P < 0.01; ***, P < 0.001. (G and H) Splenocytes from the indicated poly(I:C)-primed mice were incubated for 6 h with B16 cells. Expression of CD107a on NK cells (NK1.1+CD3−; G) or DNAM-1+ NK cells (NK1.1+CD3−DNAM-1+; H) was analyzed by flow cytometry. Splenocytes alone or splenocytes stimulated with phorbol myristate acetate and ionomycin (PMA/iono) served as controls. Representative dot plots are shown in (G, left). Percentages of CD107a-positive NK cells are shown above the blue boxes. Average values with SDs of triplicate values from one representative experiment are depicted in G (right; H). Unpaired Student’s t tests were performed. ***, P < 0.001. Representative of n = 4 (G and H).

