Fig. 4.

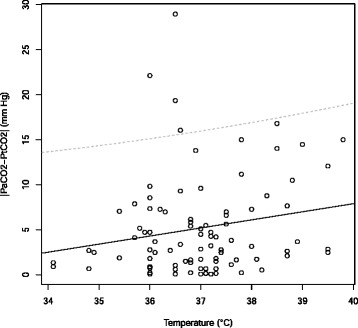
Linear regression between temperature and difference between PaCO2 and PtCO2 (|PaCO2-PtCO 2|). Regression line is the continuous line, the dotted lines show the 95 % confidence interval

Linear regression between temperature and difference between PaCO2 and PtCO2 (|PaCO2-PtCO 2|). Regression line is the continuous line, the dotted lines show the 95 % confidence interval