
Fig. 4.
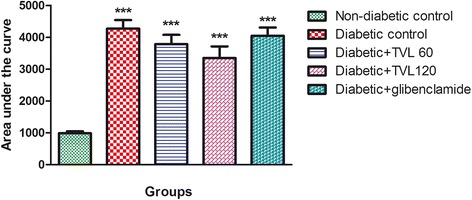
Area under the curve determined from OGTT graph of non-diabetic and diabetic rats. All data are expressed as mean ± SEM for 7 animals per group. ***Significantly different compared to non-diabetic control, p < 0.001
Official websites use .gov
A
.gov website belongs to an official
government organization in the United States.
Secure .gov websites use HTTPS
A lock (
) or https:// means you've safely
connected to the .gov website. Share sensitive
information only on official, secure websites.
Area under the curve determined from OGTT graph of non-diabetic and diabetic rats. All data are expressed as mean ± SEM for 7 animals per group. ***Significantly different compared to non-diabetic control, p < 0.001