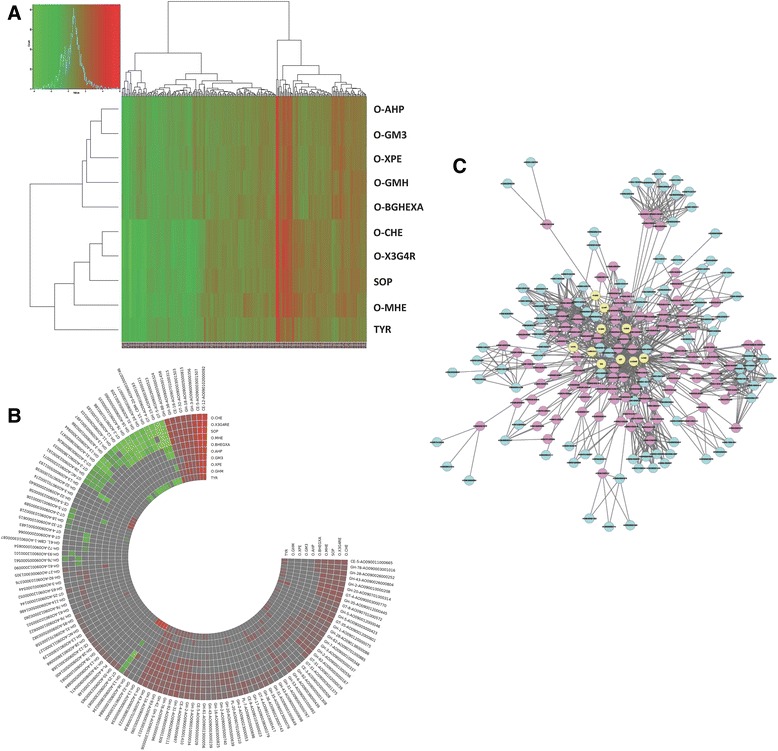
Fig. 4.

The effects of the different enzyme inducers on the gene expression of extracellular proteins and CAZys. a Heatmap of the gene expression profile for genes encoding extracellular proteins with significantly differential expression in the enzyme inducers compared to glucose. The clustering tree or the dendogram displayed was based on the heat map of the hierarchical clustering. b Heatmap of the differential gene expression profile of the 124 CAZy transcripts in the enzyme inducers compared to glucose. c A network of interactions between genes and inducers; blue nodes are genes encoding CAZys with significant differential expression between the inducers and glucose, red nodes are genes with significant differential expression between induces and glucose that were derived using the ´´guilt-by-association´´ approach, yellow nodes are the individual inducers
