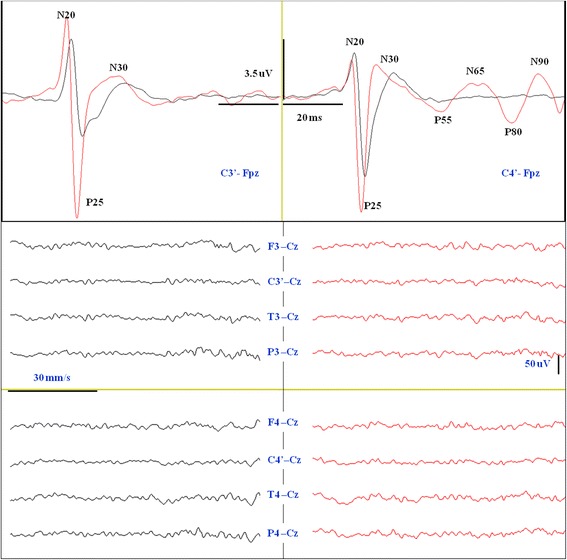
Fig. 3.

Somatosensory evoked potentials (SSEP) recording at 12 h after cardiac arrest in patient 5 of our series who had consciousness recovery and CPC 1–2. Upper: cortical SSEP (C3’/C4’–Fpz). Note the increase in amplitude and the decrease in latency of the N20/P25 evoked potentials at 50 mA electrical stimulation (red line) with respect to the baseline (black line) at 10 mA. Note also the appearance of ML-SSEPs (P55/N65 and P80/N90) at 50 mA stimulation on the left median nerve (red line). Lower: 8-channel electroencephalogram (EEG) (F3/F4-Cz, C3’/C4’–Cz, T3/T4–Cz, P3/P4–Cz) performed in the same session of SSEP. No significant background EEG pattern change is detected between baseline recordings (black lines) with respect to the stimulation at 50 mA (red lines)
