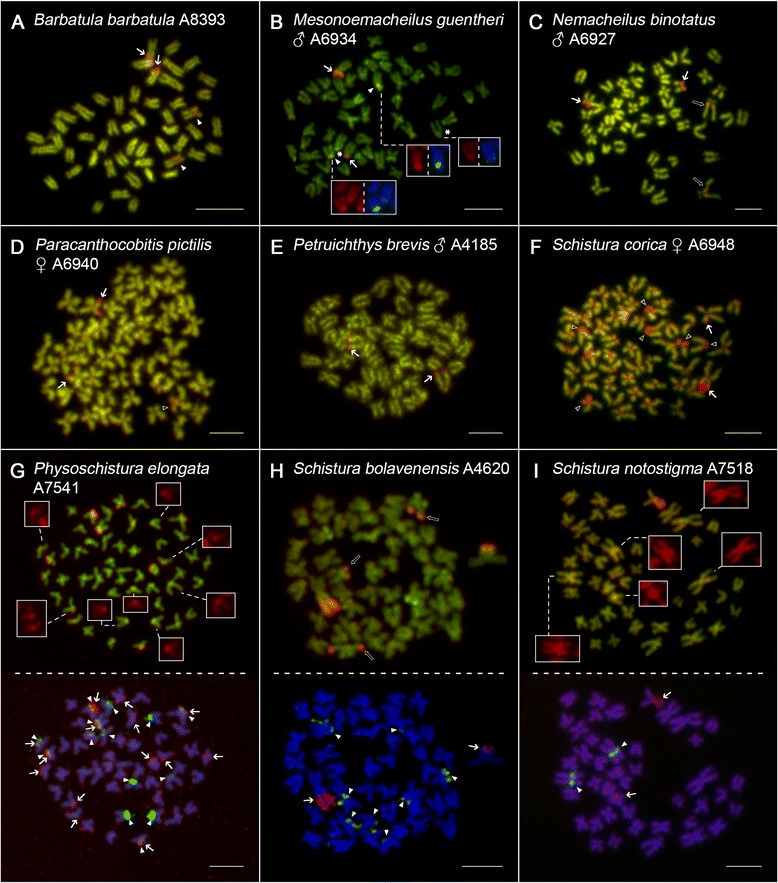
Fig. 6.

Mitotic metaphases of selected nemacheilid species after CDD banding. a, c, d, e, f single metaphases; b metaphase arranged with boxes showing particular chromosomes sequentially after CDD banding and dual-colour rDNA FISH. g-i whole metaphases arranged sequentially – after CDD banding (upper row) and corresponding dual-colour FISH showing locations of 45S rDNA and 5S rDNA (lower row). a B. barbatula, b M. guentheri, c N. binotatus, d P. pictilis, e P. brevis, f S. corica, g P. elongata, h S. bolavenensis, i S. notostigma. For better contrast, CDD-banded pictures were pseudocoloured in red (for CMA3) and green (for DAPI). FISH metaphases follow the same colour scheme as in Figs. 2, 3, 4 and 5. Arrows show CMA3 +/45S rDNA sites, arrowheads show CMA3 +/5S sites, open arrowheads show a putative CMA3 +/5S sites and open arrows show CMA3 + regions non-related to rDNAs and minor/putative CMA3 + sites. In the particular case of M. guentheri (b), note the CMA3-negative 5S rDNA sites (denoted by asterisk), while the remaining boxes clearly show CMA3 +/5S rDNA sites. In non-sequential metaphases (a-f), considering the number and location of CMA3 + signals in comparison to respective FISH karyotypes (Fig. 2 and Additional file 7: Figure S3), the association between 45S rDNA and CMA3 + sites is clearly apparent from pics. and the same is true also for some or all 5S rDNA sites in (a, d and f). Due to the close proximity of 5S rDNA sites to centromeres (which are usually AT-rich and display bright fluorescence), some CMA3 +/5S rDNA sites are not clearly apparent from the pictures, therefore they are boxed with a separate channel for CMA3 (red) (b, g, i). Note the significant spreading of CMA3 + regions in centromeres of S. corica (f) and CMA3-positive ITSs in N. binotatus (c). Bar = 10 μm
