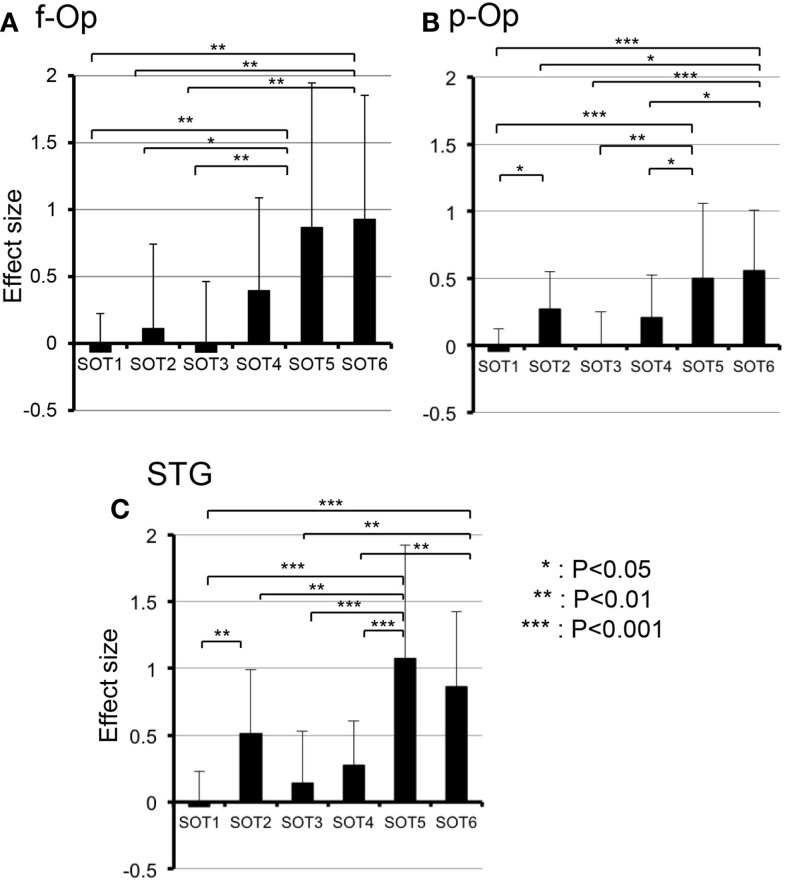
Figure 5.
Comparison of hemodynamic responses [effect sizes in Oxy-Hb concentration during each sensory organization test SOT)] among the six SOT conditions in the right frontal operculum/inferior frontal gyrus (f-Op) (A), right parietal operculum (p-Op) (B), and right superior temporal gyrus (STG) (C). These three ROIs indicated significant main effects of the SOT conditions in subsidiary statistical analyses after two-factorial ANOVA with repeated-measures (SOT condition × ROI). ***, **, *Significant difference between different SOT conditions in post hoc tests at P < 0.001, P < 0.01, and P < 0.05, respectively.

