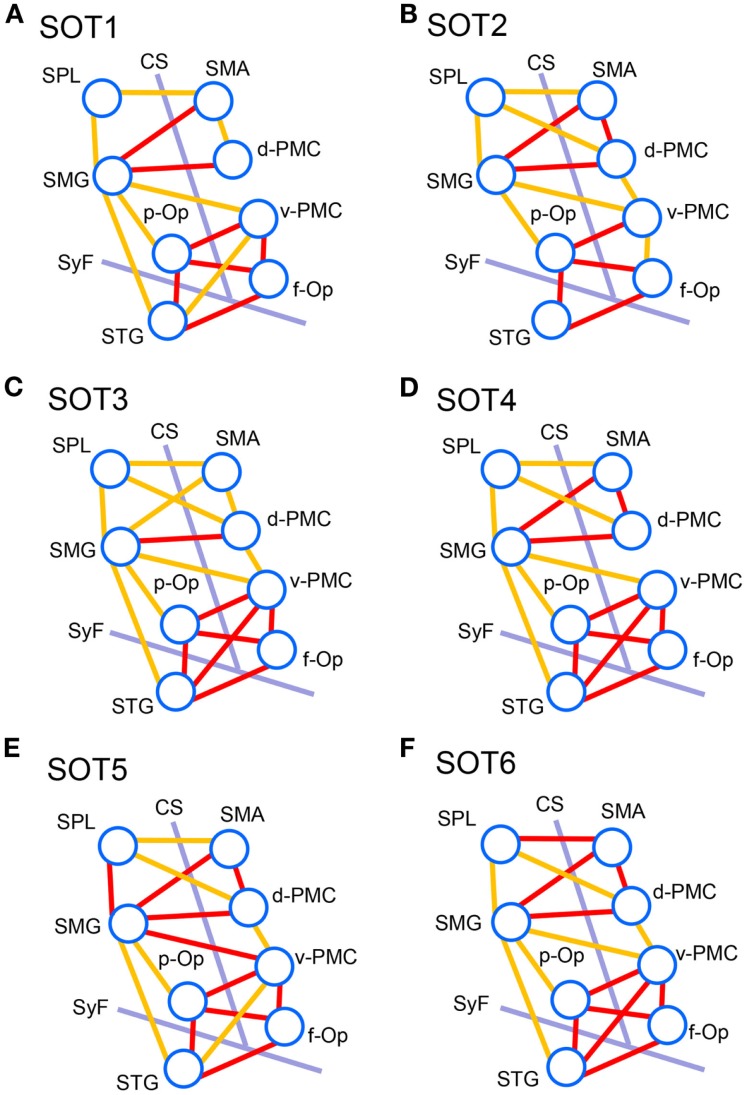
Figure 8.
Schematic presentation of functional connectivity maps among the activated cortical regions in NIRS-SPM under the six sensory organization test (SOT) conditions. (A-F) indicate functional connectivity maps in SOT 1–6, respectively. The orange and red lines show correlations > 0.6 and 0.7 (averaged across all participants), respectively. f-Op, right frontal operculum/inferior frontal gyrus; p-Op, right parietal operculum; SMG, right supramarginal gyrus; STG, right superior temporal gyrus; d-PMC, dorsal premotor cortex in the right hemisphere; v-PMC, ventral premotor cortex; SPL, superior parietal lobule; SAC, somatosensory association cortex; SMA, supplementary motor area; CS, central sulcus in the right hemisphere; SyF, Sylvian fissure in the right hemisphere.

