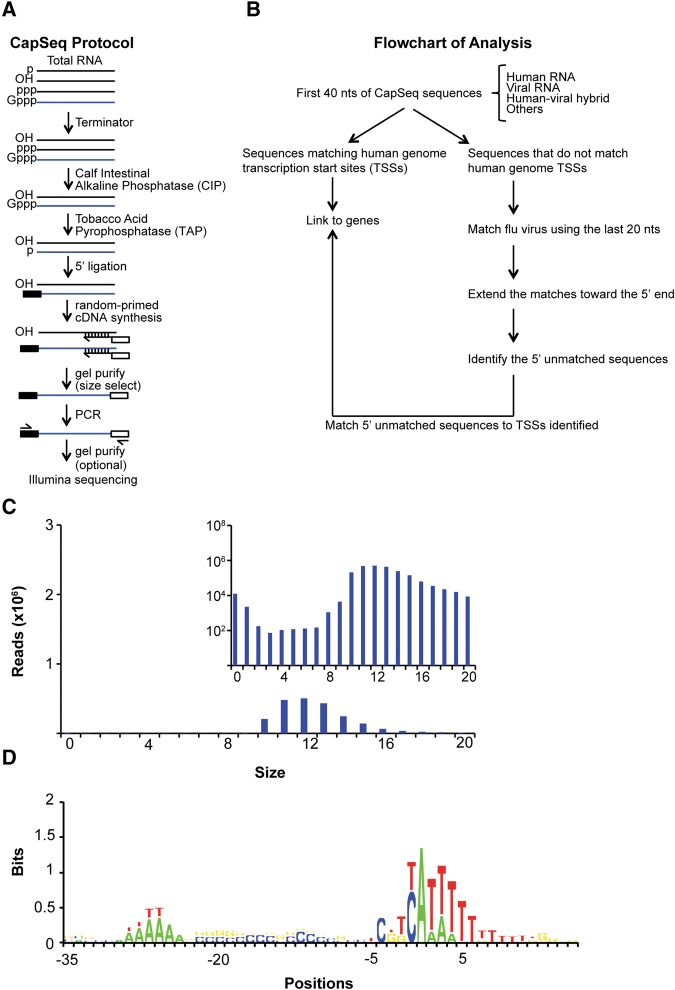
FIGURE 1.
CapSeq method and verification of size and motif analysis of snatched caps identified by CapSeq. (A) Schematic of CapSeq method. (B) Flowchart of applying CapSeq to examine IAV cap-snatching. (TSSs) transcription start sites, (nt) nucleotide. (C) Size distribution of the snatched sequences extracted from reads mapped to IAV. The 5′ extra sequences snatched by IAV were extracted from reads mapped to the positive strand (mRNA) of influenza virus. The inset figure uses log scale on the Y-axis to demonstrate the trend of the extra sequences derived from the positive virus strand. (D) Motif analysis of human Pol II TSSs using CapSeq reads. Genomic positions flanking the 5′ end (+1) of each matched CapSeq read are aligned with negative numbers indicating upstream positions. The log2 ratio of the experimental frequency over the expected frequency for each nucleotide was obtained as the bits on the Y-axis. Regardless of the abundance of the CapSeq reads, each mapped genomic locus was only counted once in this analysis.

